LG 29EA93 Monitor Review - Rev. 1.25
by Chris Heinonen on February 12, 2013 8:49 PM ESTLG also offers its own hardware and software calibration package for the 29EA93. Using a custom designed colorimeter, the hardware and software only work with LG monitors but are scheduled to sell for less than competing products from XRite and Datacolor. I mentioned earlier in the review that colorimeters are prone to errors on displays with LED backlights like the LG. This is a general rule, but since LG knows the spectral response of their displays they can program that into their own colorimeters, leading to much better results than a generic colorimeter. It usually won’t be as good as a meter profiled with a spectrometer due to sample variations, but it will be much better than without.
Using their own software and probe, I calibrated the display to the same settings I use: 200 cd/m² and a gamma of 2.2. An sRGB gamma curve is not supported, nor are colorspaces larger than sRGB with this version, but on their professional monitors with a more advanced meter, different colorspaces are supported. The process is very simple: You choose your targets, it will pop up a spot for the calibration puck on screen, and then you let it run the calibration. The process locks the monitor OSD controls as it adjusts it automatically, and then at the end it will create an ICC profile for you and install it.


To evaluate this profile, I again used CalMAN and used the same set of images that we use for our smartphone and tablet testing. Using the automated test pattern generator in CalMAN wasn’t possible, as it would attempt to load its own ICC profile and change the setting in the display. On first look, we see 197.3 cd/m² of light output and 0.19 cd/m² on a black screen for a contrast ratio of 1039:1. This wasn’t as good as I was able to achieve using CalMAN, which might indicate that it is obtaining the peak-white level differently. With CalMAN I could use the Contrast and Brightness controls to get just above 200 cd/m², allowing maximum headroom to adjust the curves to get accurate color. The LG software might not bring these down as much, and then bring down the RGB curves even more, which would lower headroom compared to the other method.
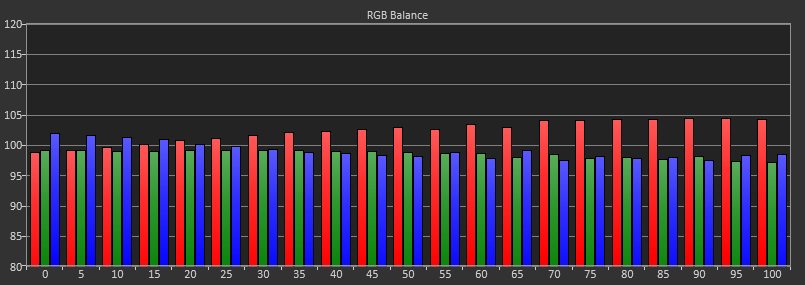
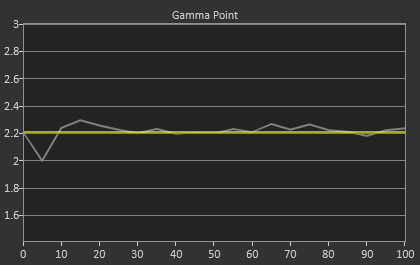
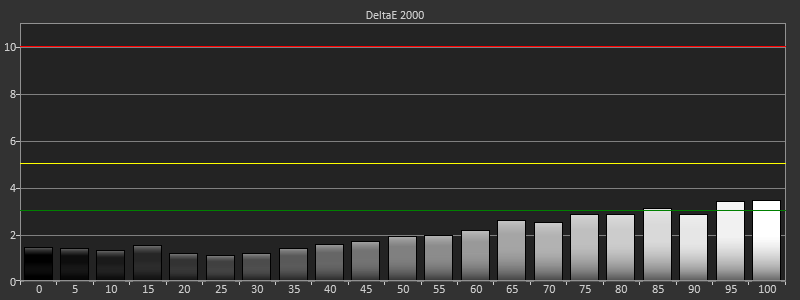
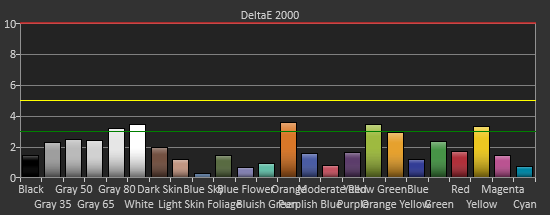
Our CCT average is 6415, but a look at the RGB balance shows that it starts out very good but then drifts a little towards the warmer, redish tint that the CCT reflects. Gamma is almost spot on at 2.21, save for a dip at 5% that most people won’t catch as they only measure in 10% increments. The dE2000 values follow the RGB balance as well, starting out very low but eventually drifting up to a level where a reddish tint will be slightly visible. The average dE2000 for the grayscale is 2.09, a number that is decent but not as good as CalMAN was able to achieve.
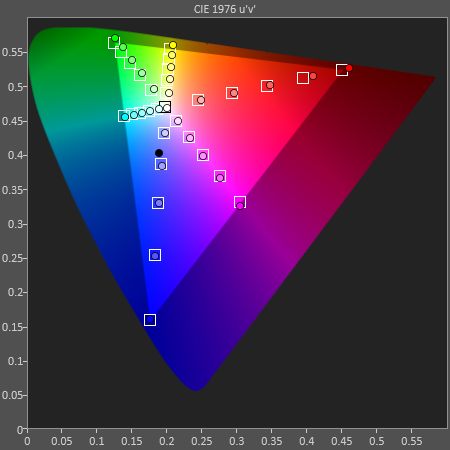
Looking at the Saturations and Color Checker charts, we see improvements but not to the degree that CalMAN allows. Our Color Checker dE2000 is 1.96, but with higher grayscale errors as well as larger errors in the over-saturated colors of red, yellow, and green. Blues also exhibit a bit of over-saturation as well, indicating that the LG sensor isn’t quite as sensitive as the C6 colorimeter, since blue is harder to read.
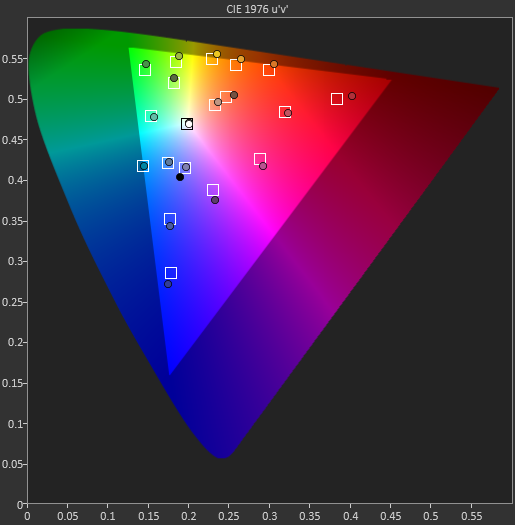
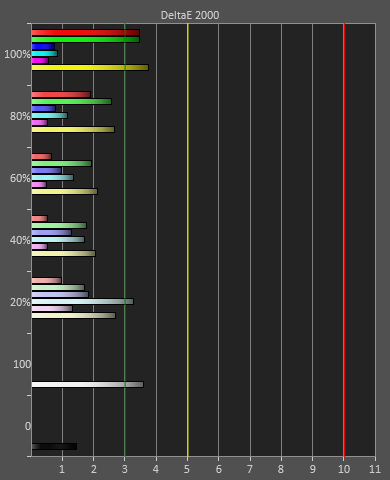
On the saturations data, we see that the Red/Yellow/Green side of the triangle has larger and larger errors as those colors get more saturated. With the over-saturated gamut, this is what we expect to see. Unfortunately none of the calibration software seems to be able to fully pull those points in and correct the over-saturated gamut there, leaving a bit of an error. The overall error is still fairly low, and with most colors not being fully saturated, that over-saturated error isn’t really bad, but better results were obtained with the CalMAN software.
Overall the LG software and hardware solution does do a decent job, but it can’t compete with what is possible using CalMAN with better hardware. Of course, the CalMAN solution with a C6 and i1Pro meter retails for closer to $2,000 than $100, so they are very different spectrums of performance. For $100, I would say the LG results are quite good and will satisfy those that aren’t graphics or video professionals most likely. Just the superior gamma will make a large difference when viewing thanks to the superior dynamic range.


108 Comments
View All Comments
Lifted - Tuesday, February 12, 2013 - link
Just to clarify, that was all on the homepage, before clicking on the review. I only clicked on the review as the last tiny little paragraph, tucked in below the image, gave a clue that it may be worth a read. That last paragraph should go up top.inighthawki - Tuesday, February 12, 2013 - link
Same here, I almost stopped reading after about two sentences. The only reason I continued was because I believed down to earth there had to be a "but" in there somewhere, nobody could actually start a review and just say "it's bad" and be done with it :).bovinda - Tuesday, February 12, 2013 - link
I actually liked the way it was done - it set the stage well. I actually think the first few sentences do a good job of piquing one's curiosity, for exactly the reasons inighthawki stated. I wouldn't have changed it. To each their own. :)niva - Tuesday, February 12, 2013 - link
Right on, this is exactly how I felt. The title and first few words in this article almost caused me to not read thinking it was a bad product... subsequently it turned out it's actually a really good display.THizzle7XU - Tuesday, February 12, 2013 - link
Ya, the entire opening of this article made it sound like the first review was a disaster of a product. I went back to read it and it was actually a mixed, leaning positive review of the 1.09 version. And this is the much improved version.Very misleading opening...
cheinonen - Wednesday, February 13, 2013 - link
Alright, I'll get an edit in there then to make it more clear. I liked the opening, but it seems that what is clear in my head certainly didn't get communicated well once it was written.wujj123456 - Tuesday, February 12, 2013 - link
Does anyone know detailed documentations of how to perform these calibration and tests? I just searched a bit, and the CalMAN software/tool doesn't seem to be expensive. I'd love to get a hold of it so that I can calibrate my own monitors.I've been long aware that many monitors look so awful without calibration, but without a good workflow, I was just messing around until I am comfortable with what I saw...
jjj - Tuesday, February 12, 2013 - link
It's not so much about the software but the hardware , you can try to rent or find a store that calibrates screens for cheap or at the very least try the ICC profiles on TFT Central.,if they have one for your screen.cheinonen - Wednesday, February 13, 2013 - link
The PC portion of CalMAN is still in an Open Beta, which is why the uniformity numbers aren't taken from CalMAN. I can export all of the data to use, but I can't have it generate the charts for me the way that I want them yet.The real cost is hardware. As mentioned in the LG Calibration Hardware review, I'm using an i1Pro ($900 or so), a SpectraCal C6 ($700), and CalMAN ($400 or so for this package). You can get decent results with a cheaper meter, but it can also be hit-and-miss depending on the display. Most PC calibration is fairly automated, it's video displays that take a lot more work to get right.
CalMAN has a free download available I believe. It only uses a simulated meter, so you can't take actual measurements, but you could get that and then the open beta of the PC Calibration Workflow on their forums and see how it works.
kevith - Tuesday, February 12, 2013 - link
Watch out, or that's gonna be your new title...Nice review.