LG 29EA93 Monitor Review - Rev. 1.25
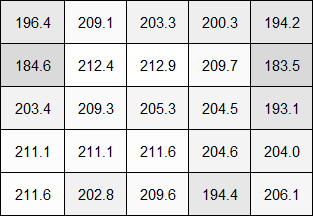
by Chris Heinonen on February 12, 2013 8:49 PM ESTThe initial revision of the LG 29EA93 was very uniform overall, where I remarked, “For white uniformity, the 29EA93 is truly a cut above.” Despite this, LG was unhappy about the performance of the corners and went back and tightened the tolerances of assembling the screen to get better performance out of it. Unlike before, no areas drop below 180 cd/m² of light output, keeping the whole screen uniform within 10% when using the same 5x5 ANSI test pattern as before.
Light Output in cd/m2
Output Deviation Relative to Center
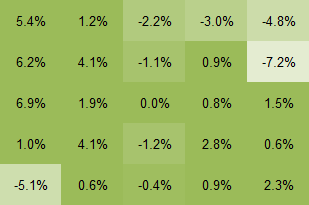
There are two points on the side that are slightly darker, in the same location as before, but the light loss in those areas is less than before. Overall the white uniformity manages to maintain its reputation of being great.
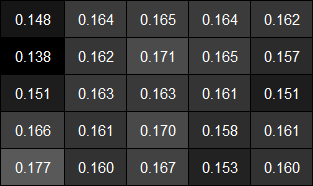
Black Uniformity is what had the issue before, with the corners having a lot more light creeping into the corners. This time that condition no longer exists. The only actual error that you can see is that one of the dimmer areas from the white uniformity is very dim in the black uniformity screen as well, but something being darker rather than lighter is a good thing.
Light Output in cd/m2
Output Deviation Relative to Center
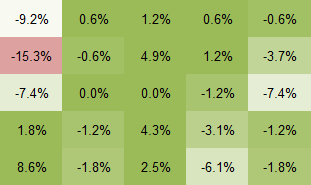
Now looking at contrast uniformity, we see the most impressive result for the 29EA93 yet. The average contrast value here is 1267:1, and the corners maintain a contrast level of 1252:1. This is now the best display I’ve seen in terms of contrast uniformity, with no areas of the screen that are a cause of concern to me at all. I really hope other manufacturers see what LG was able to do here with better quality control and bring that to their displays to provide similar results.
Contrast Ratio
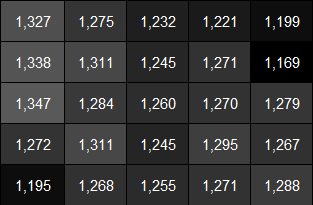
Contrast Ratio Deviation Relative to Center
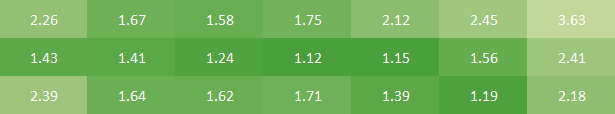
For dE uniformity, I used the Uniformity tool available in CalMAN that can measure up to 45 points on the screen. For this display I used 21 points, in a 7x3 grid, which was a perfect match to the 21:9 ratio of the screen. The Uniformity tool isn’t completely finished yet, which is why I didn’t use it for brightness yet, but the dE uniformity is close to what we used to do, only with more data. Once the Uniformity tool is finished it’ll provide even better data, and I can go back to this review and update the graphs to match.
As you can see the center of the screen has very good color quality that we saw earlier. The extreme corners exhibit a bit of color drift with dE values that are a little worse, but only the upper-right corner moves past the 3.0 value that would indicate a color change that we can see. In comparison to the contrast numbers the color quality is only very good, but as this is the first display to be tested this way, it wouldn’t surprise me if this is the best display we see for a while and this method only accentuates the errors.
Colorchecker dE Uniformity
The LG 29EA93 was already a very good performer when it came to uniformity, and the improvements that LG made only increase that performance. The extra attention paid to make sure that the assembly of the extra-wide panel is done right has served to produce the most uniform consumer display that I’ve seen so far.


108 Comments
View All Comments
Lifted - Tuesday, February 12, 2013 - link
Just to clarify, that was all on the homepage, before clicking on the review. I only clicked on the review as the last tiny little paragraph, tucked in below the image, gave a clue that it may be worth a read. That last paragraph should go up top.inighthawki - Tuesday, February 12, 2013 - link
Same here, I almost stopped reading after about two sentences. The only reason I continued was because I believed down to earth there had to be a "but" in there somewhere, nobody could actually start a review and just say "it's bad" and be done with it :).bovinda - Tuesday, February 12, 2013 - link
I actually liked the way it was done - it set the stage well. I actually think the first few sentences do a good job of piquing one's curiosity, for exactly the reasons inighthawki stated. I wouldn't have changed it. To each their own. :)niva - Tuesday, February 12, 2013 - link
Right on, this is exactly how I felt. The title and first few words in this article almost caused me to not read thinking it was a bad product... subsequently it turned out it's actually a really good display.THizzle7XU - Tuesday, February 12, 2013 - link
Ya, the entire opening of this article made it sound like the first review was a disaster of a product. I went back to read it and it was actually a mixed, leaning positive review of the 1.09 version. And this is the much improved version.Very misleading opening...
cheinonen - Wednesday, February 13, 2013 - link
Alright, I'll get an edit in there then to make it more clear. I liked the opening, but it seems that what is clear in my head certainly didn't get communicated well once it was written.wujj123456 - Tuesday, February 12, 2013 - link
Does anyone know detailed documentations of how to perform these calibration and tests? I just searched a bit, and the CalMAN software/tool doesn't seem to be expensive. I'd love to get a hold of it so that I can calibrate my own monitors.I've been long aware that many monitors look so awful without calibration, but without a good workflow, I was just messing around until I am comfortable with what I saw...
jjj - Tuesday, February 12, 2013 - link
It's not so much about the software but the hardware , you can try to rent or find a store that calibrates screens for cheap or at the very least try the ICC profiles on TFT Central.,if they have one for your screen.cheinonen - Wednesday, February 13, 2013 - link
The PC portion of CalMAN is still in an Open Beta, which is why the uniformity numbers aren't taken from CalMAN. I can export all of the data to use, but I can't have it generate the charts for me the way that I want them yet.The real cost is hardware. As mentioned in the LG Calibration Hardware review, I'm using an i1Pro ($900 or so), a SpectraCal C6 ($700), and CalMAN ($400 or so for this package). You can get decent results with a cheaper meter, but it can also be hit-and-miss depending on the display. Most PC calibration is fairly automated, it's video displays that take a lot more work to get right.
CalMAN has a free download available I believe. It only uses a simulated meter, so you can't take actual measurements, but you could get that and then the open beta of the PC Calibration Workflow on their forums and see how it works.
kevith - Tuesday, February 12, 2013 - link
Watch out, or that's gonna be your new title...Nice review.