ASRock X79 Extreme11 Review: PCIe 3.0 x16/x16/x16/x16 and LSI 8-Way SAS/SATA
by Ian Cutress on September 3, 2012 10:15 AM EST- Posted in
- Motherboards
- ASRock
- X79
- LSI
- PLX
Notes About CPU Performance
In our recent reviews, we have discussed at length the impact of what is called 'MultiCore Enhancement' or MCE. Please read our discussion article about this technology here. The effect of this technology is extra MHz under full loading at stock settings - i.e. the speed you get out of your processor is affected by the motherboard you purchase. The board applies a small OC to the processor in effect, which increases power draw but should still be within the limits of the hardware being used. This 'feature' is relatively new, but it does mean that some motherboards have a CPU advantage.
The following motherboards are known to have this feature:
- ASUS: X79 and Z77
- Gigabyte: Z77
- ASRock: Z77 OC Formula (later BIOS)
- EVGA: Z77 FTW (later BIOS)
In this case, ASRock have decided not to apply it to the X79 Extreme11 in this review.
3D Movement Algorithm Test
The algorithms in 3DPM employ both uniform random number generation or normal distribution random number generation, and vary in various amounts of trigonometric operations, conditional statements, generation and rejection, fused operations, etc. The benchmark runs through six algorithms for a specified number of particles and steps, and calculates the speed of each algorithm, then sums them all for a final score. This is an example of a real world situation that a computational scientist may find themselves in, rather than a pure synthetic benchmark. The benchmark is also parallel between particles simulated, and we test the single thread performance as well as the multi-threaded performance.
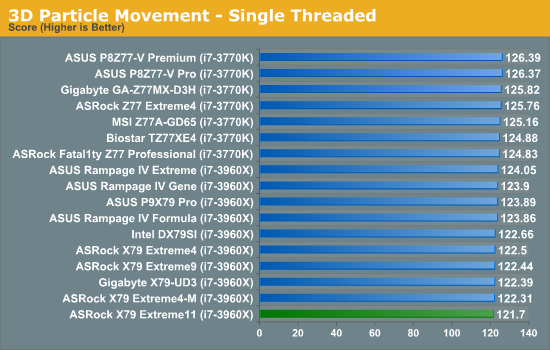
In single threaded performance, there is a clear separation between Z77 and X79, though not by much. ASRock's algorithm for ramping up the CPU speed seems a little flawed, as their boards tend to fall towards the bottom of the rankings.
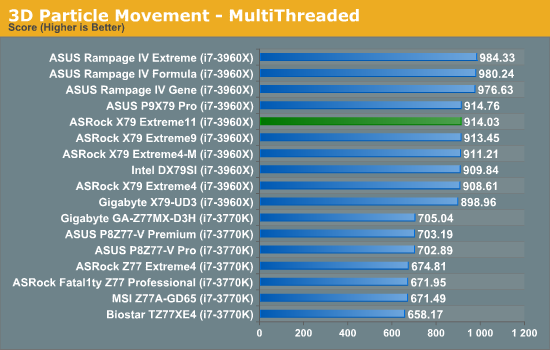
In terms of multithreaded performance, the ASRock X79 Extreme11 takes a standard place for a non-MCE enabled X79 board.
WinRAR x64 3.93 - link
With 64-bit WinRAR, we compress the set of files used in the USB speed tests. WinRAR x64 3.93 attempts to use multithreading when possible, and provides as a good test for when a system has variable threaded load. If a system has multiple speeds to invoke at different loading, the switching between those speeds will determine how well the system will do.
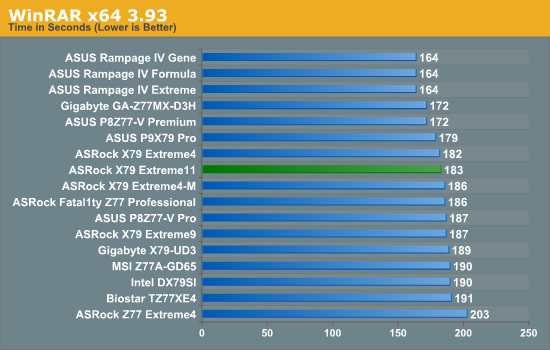
Due to the variable multithreaded nature of WinRAR, MCE enabled boards and those with aggressive ratio changing setting do well here. The ASRock X79 Extreme11 in contrast sits in the middle of the pack.
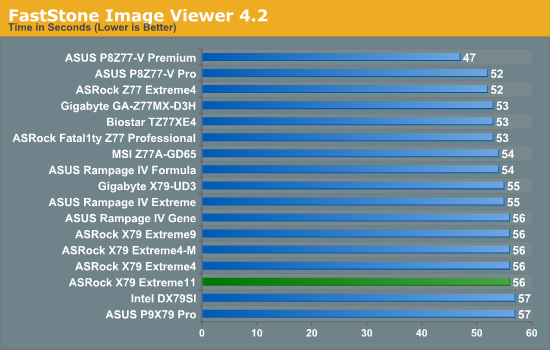
FastStone Image Viewer 4.2 - link
FastStone Image Viewer is a free piece of software I have been using for quite a few years now. It allows quick viewing of flat images, as well as resizing, changing color depth, adding simple text or simple filters. It also has a bulk image conversion tool, which we use here. The software currently operates only in single-thread mode, which should change in later versions of the software. For this test, we convert a series of 170 files, of various resolutions, dimensions and types (of a total size of 163MB), all to the .gif format of 640x480 dimensions.
Xilisoft Video Converter
With XVC, users can convert any type of normal video to any compatible format for smartphones, tablets and other devices. By default, it uses all available threads on the system, and in the presence of appropriate graphics cards, can utilize CUDA for NVIDIA GPUs as well as AMD APP for AMD GPUs. For this test, we use a set of 32 HD videos, each lasting 30 seconds, and convert them from 1080p to an iPod H.264 video format using just the CPU. The time taken to convert these videos gives us our result.
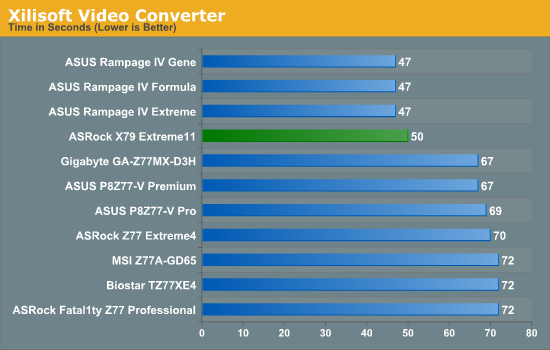
As XVC loves cores and MHz speed, so X79 with a 6C/12T CPU beats all Z77 and 4C/8T CPUs, and MCE wins out. Though the ASRock only loses 3 seconds to the ROG boards, showcasing that for a workstation based on CPU performance, X79 is the top choice.
x264 HD Benchmark
The x264 HD Benchmark uses a common HD encoding tool to process an HD MPEG2 source at 1280x720 at 3963 Kbps. This test represents a standardized result which can be compared across other reviews, and is dependant on both CPU power and memory speed. The benchmark performs a 2-pass encode, and the results shown are the average of each pass performed four times.
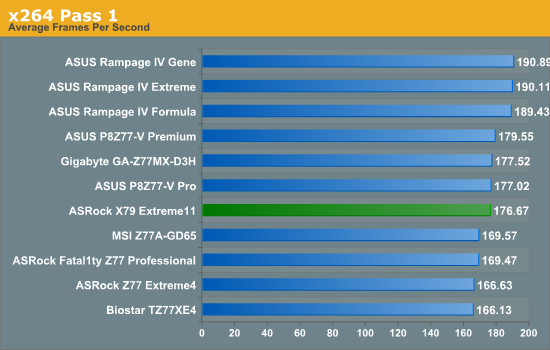
The variable nature of the first pass of our test shows that MHz counts more than cores - MCE enabled boards win here.
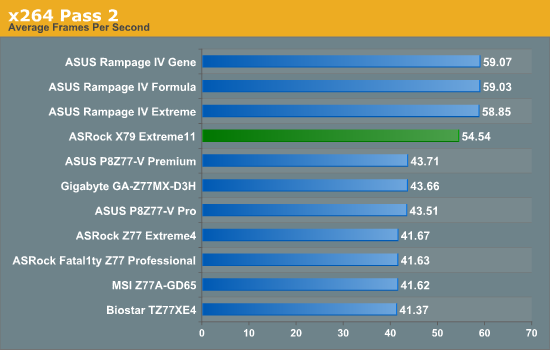
The second pass in contrast loves cores and MHz, with distinct separation between X79 and Z77, the separation between MCE and non-MCE boards.


62 Comments
View All Comments
MySchizoBuddy - Thursday, September 6, 2012 - link
where is the CUDA/OpenCL benchmark with 7 GPUs?alan brimble - Tuesday, May 28, 2013 - link
Good Afternoon guys,pardon my ignorance, but i have the rampage 4 extreme and can already take advantage of the quad sli features as i am using 2 gtx690's in the pcie x 16 lanes.I like the idea of all those sata 6gb ports as i think they could come in handy.The rampage has 2 asmedia at 6gb and 2 normal 6gb ports which i have taken use off. Would it be worth upgrading to this board or wait for Asus to no doubtably match this board with another release maybe soon.