NVIDIA GeForce GTX 680 Review: Retaking The Performance Crown
by Ryan Smith on March 22, 2012 9:00 AM ESTTheoreticals
As with any new architecture, we want to take a few moments to look at theoretical performance. These numbers shouldn’t be taken too seriously for cross-vendor comparison, but these numbers often tell us more about interesting architectural improvements that occur from one generation to the next.

Our first theoretical test is perhaps the most perplexing: 3DMark Vantage’s pixel fill test. Typically this test is memory bandwidth bound as the nature of the test has the ROPs pushing as many pixels as possible with as little overhead as possible, which in turn shifts the bottleneck to a mix of ROP performance and the memory bandwidth needed to feed those ROPs.
Compared to the GTX 580, the GTX 680 has almost exactly the same amount of memory bandwidth (192GB/sec) and only 86% of the theoretical ROP performance (37Gpix vs. 32Gpix). In short, it shouldn’t outperform the GTX 580 here, and yet it outperforms the 580 by 33%.
Why does it do this? That’s the hard thing to answer. As we mentioned in our look at GK104’s architecture, NVIDIA did make some minor incremental improvements to their ROPs coming from GF114, such as slightly improved compression and improved polygon merging. One of those may very well be the contributing factor, particularly the compression improvements since this is a typically memory bandwidth bottlenecked test. Alternatively, it’s interesting to note that the difference between the two video cards is almost identical to the difference in the core clock. GTX 560 Ti’s results tend to blow a hole in this theory, but it bears consideration.
In any case, it’s an interesting turn of events and hopefully one that isn’t simply an edge case. As we’ve seen in our benchmarks GTX 680 has strong performance – even if its lead compared to the 7970 diminishes with resolution – but compared to the GTX 580 in particular it needs strong ROP performance across all games in order to deliver good performance at high resolutions and anti-aliasing.
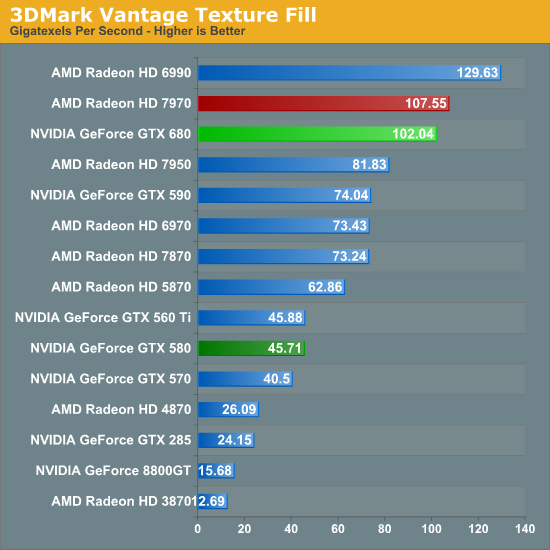
Our second theoretical test is 3DMark Vantage’s texture fill test, which to no surprise has the GTX 680 handily clobbering all prior NVIDIA cards. NVIDIA’s inclusion of 128 texture units on GK104 versus 64 on their previous generation GPUs gives the GTX 680 far better texturing performance. The 30%+ core clock difference only serves to further widen the gap.
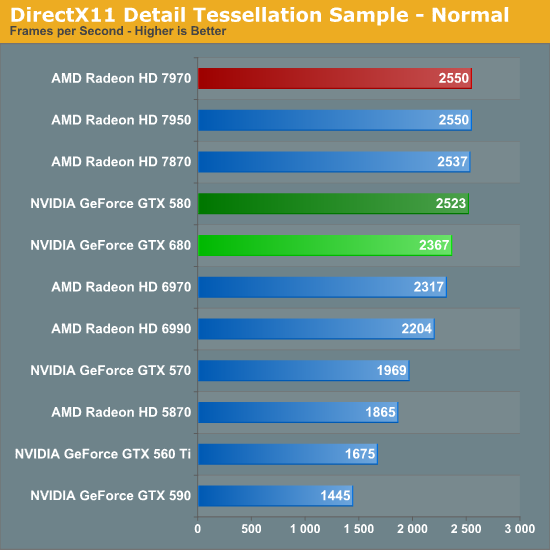
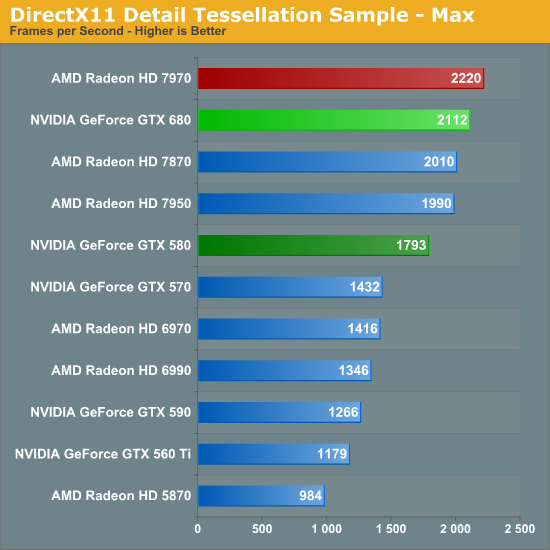
Our third theoretical test is the set of settings we use with Microsoft’s Detail Tessellation sample program out of the DX11 SDK. Overall while NVIDIA didn’t make any significant changes to their tessellation hardware (peak triangle rate is still 4/cycle), they have been working on further improving performance at absurdly high tessellation factors. You can see some of this in action at the max factor setting, but even then we’re running into a general performance wall since the Detail Tessellation program can’t go to the absolute highest tessellation factors NVIDIA’s hardware supports.
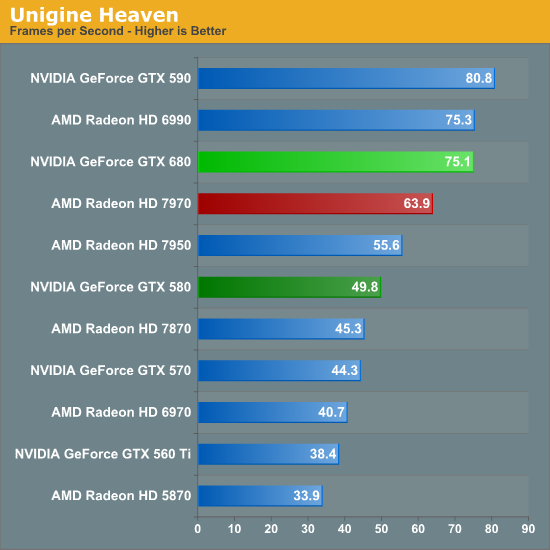
Our final theoretical test is Unigine Heaven 2.5, a benchmark that straddles the line between a synthetic benchmark and a real-world benchmark as the engine is licensed but no notable DX11 games have been produced using it yet. In any case the Heaven benchmark is notable for its heavy use of tessellation, which means it’s largely a proxy test for tessellation performance. Here we can see the GTX 680 shoot well ahead of the GTX 580 – by more than we saw in the DX11 Detail Tessellation sample – but at the same time there’s a lot more going on in Heaven than just tessellation.
Honestly at this point in time I’m not sure just how much more tessellation performance is going to matter. Until DX11 is the baseline API for games, tessellation is still an add-on feature, which means it’s being used to add fine detail to specific models rather than being used on everything in a game world. This demands good tessellation at high factors but at the same time it’s subject to diminishing returns on the improvement to image quality as triangles reach single pixel sizes and smaller. To that end I’m still waiting to see the day where we see tessellation scale similarly to textures – that is by using full MIP chaining of displacement maps – at which point we can evaluate tessellation performance similar to texture performance when it comes to both measuring the performance hit and evaluating the difference in image quality.


404 Comments
View All Comments
maximumGPU - Saturday, March 24, 2012 - link
"The benchmarks are tight in front of your faces!"and judging by your conclusion it seems you didn't even read them..
Skiddywinks - Saturday, March 24, 2012 - link
"The benchmarks are tight in front of your faces! "No s***, Sherlock.
"The 680 is tied with the 7950, which surpasses it by a little, and the 7970 is the leader. "
Clearly the benchmarks in front of my face are different to the ones in front of your face.
BoFox - Monday, March 26, 2012 - link
I know, that's why I'm telling him that Anandtech Forum is a perfect place for him!BoFox - Monday, March 26, 2012 - link
Then you'll love Anandtech Forums!! It's the perfect place for you! They'll love you over there!CeriseCogburn - Tuesday, March 27, 2012 - link
It's absolutely amazing isn't it.SR81 - Saturday, March 24, 2012 - link
HardOCP has surround benches on both the 680 and 7970, surprisingly the lower bandwidth/VRAM card wins even with 4XMSAA and FXAA enabled at 5760x1200 (ex.Skyrim: 680 = 58.6, 7970 = 45.4)When Anand updates this review with surround benches it will leave no doubt which card is the absolute king. I think the articles title is rightfully deserved once testing is done :)
CeriseCogburn - Saturday, March 24, 2012 - link
Yep, saw it like 2 days ago, the ram arguments have been foolish once you crank eye candy high enough (on weak ram cards) both comps frame rates are too low to matter.dtolios - Saturday, March 24, 2012 - link
I know the AMD vs. Nvidia war is a hot topic in Anandtech - just like any other tech forum/review site etc - but one of the really hard applications for modern GPUs is production rendering acceleration.There are multiple instances were you can see reviewers trying to compare different GPUs, different architectures, SLI combinations (or just multiple GPU) combinations etc while using GPU accelerated renderers, a professional application that is relying more and more on "game" oriented boards instead of Quadro / FireGL versions (unless vram limitations get in the way).
Testing on applications like Octane Rendered, Vray 2 GPU, iRay etc, would be a nice addition to your tests - not only because those are hard to find and easily more intensive than "just gaming", but also because few sites have access to such an extensive line of hardware to pull a realistic comparison, including multiple GPUs, different generations, scalability with multiple cards etc. The only "comparison tables" you can easily find, are from people sharing their personal observation on their blog or forum - under not that repeatable conditions etc...
For some apps, Open CL could be nice to keep on the AMD vs. nVidia "hype" going on, but sadly for some of us, most of these renderers are either exclusively CUDA based, or run better on it, so it would be nice to actually do core comparisons even within the nVidia line: you see, in rendering applications, getting better scalability with multiple cards, or removing 30min out of your 2hour rendering workflow is way more important than gaining 5% FPS advantage over the other card.
You do include 3DS or similar productivity comparisons in your CPU reviews, so it only make sense to include it for your GPUs too.
poordirtfarmer2 - Monday, March 26, 2012 - link
I agree wholeheartedly! I’d love to pick the best “gaming” card for also doing pro work. Although just an amateur, I actually find myself spending more time editing and rendering videos than I do playing games.AnnonymousCoward - Saturday, March 24, 2012 - link
When 2560x1600 4xAA results in way under 60fps, IMHO it's not a very useful benchmark. Any user would go to 2xAA or no AA, to get 60fps. So who really cares how these cards compare at a setting that's never used.