NVIDIA GeForce GTX 680 Review: Retaking The Performance Crown
by Ryan Smith on March 22, 2012 9:00 AM ESTTheoreticals
As with any new architecture, we want to take a few moments to look at theoretical performance. These numbers shouldn’t be taken too seriously for cross-vendor comparison, but these numbers often tell us more about interesting architectural improvements that occur from one generation to the next.

Our first theoretical test is perhaps the most perplexing: 3DMark Vantage’s pixel fill test. Typically this test is memory bandwidth bound as the nature of the test has the ROPs pushing as many pixels as possible with as little overhead as possible, which in turn shifts the bottleneck to a mix of ROP performance and the memory bandwidth needed to feed those ROPs.
Compared to the GTX 580, the GTX 680 has almost exactly the same amount of memory bandwidth (192GB/sec) and only 86% of the theoretical ROP performance (37Gpix vs. 32Gpix). In short, it shouldn’t outperform the GTX 580 here, and yet it outperforms the 580 by 33%.
Why does it do this? That’s the hard thing to answer. As we mentioned in our look at GK104’s architecture, NVIDIA did make some minor incremental improvements to their ROPs coming from GF114, such as slightly improved compression and improved polygon merging. One of those may very well be the contributing factor, particularly the compression improvements since this is a typically memory bandwidth bottlenecked test. Alternatively, it’s interesting to note that the difference between the two video cards is almost identical to the difference in the core clock. GTX 560 Ti’s results tend to blow a hole in this theory, but it bears consideration.
In any case, it’s an interesting turn of events and hopefully one that isn’t simply an edge case. As we’ve seen in our benchmarks GTX 680 has strong performance – even if its lead compared to the 7970 diminishes with resolution – but compared to the GTX 580 in particular it needs strong ROP performance across all games in order to deliver good performance at high resolutions and anti-aliasing.
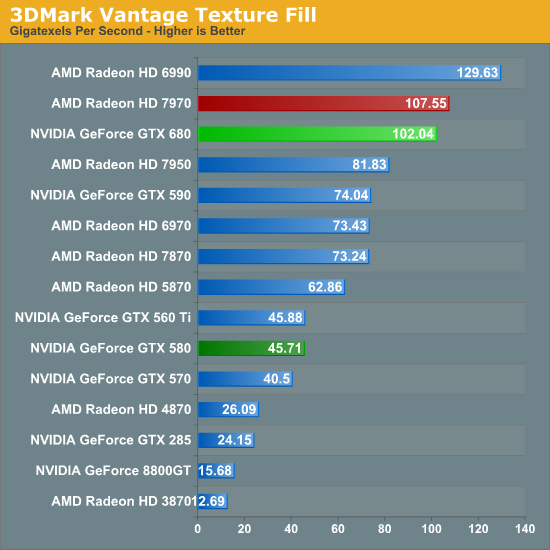
Our second theoretical test is 3DMark Vantage’s texture fill test, which to no surprise has the GTX 680 handily clobbering all prior NVIDIA cards. NVIDIA’s inclusion of 128 texture units on GK104 versus 64 on their previous generation GPUs gives the GTX 680 far better texturing performance. The 30%+ core clock difference only serves to further widen the gap.
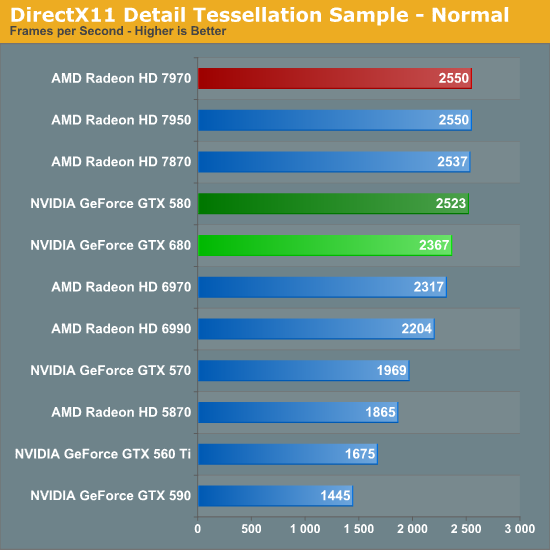
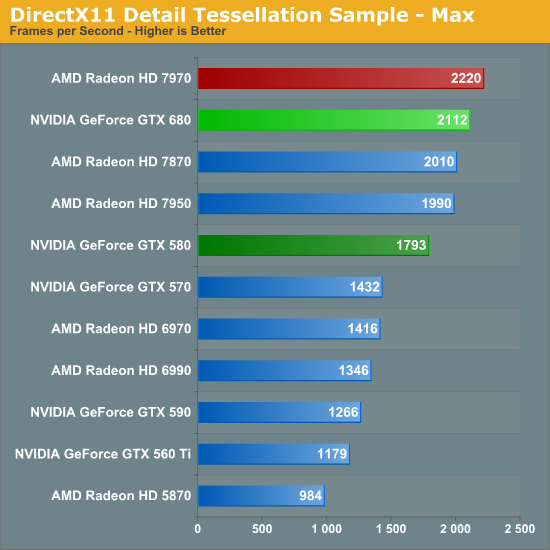
Our third theoretical test is the set of settings we use with Microsoft’s Detail Tessellation sample program out of the DX11 SDK. Overall while NVIDIA didn’t make any significant changes to their tessellation hardware (peak triangle rate is still 4/cycle), they have been working on further improving performance at absurdly high tessellation factors. You can see some of this in action at the max factor setting, but even then we’re running into a general performance wall since the Detail Tessellation program can’t go to the absolute highest tessellation factors NVIDIA’s hardware supports.
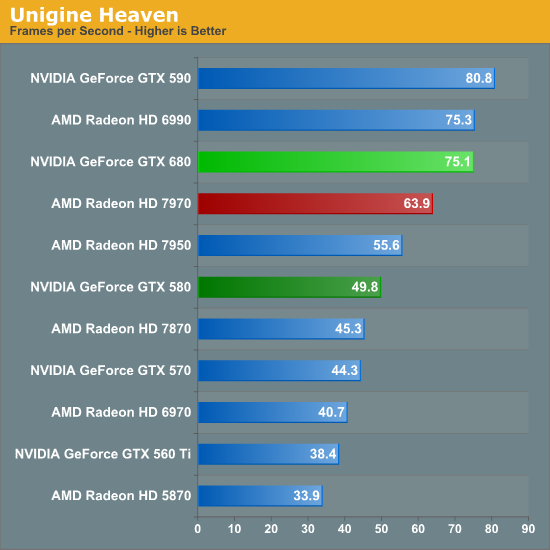
Our final theoretical test is Unigine Heaven 2.5, a benchmark that straddles the line between a synthetic benchmark and a real-world benchmark as the engine is licensed but no notable DX11 games have been produced using it yet. In any case the Heaven benchmark is notable for its heavy use of tessellation, which means it’s largely a proxy test for tessellation performance. Here we can see the GTX 680 shoot well ahead of the GTX 580 – by more than we saw in the DX11 Detail Tessellation sample – but at the same time there’s a lot more going on in Heaven than just tessellation.
Honestly at this point in time I’m not sure just how much more tessellation performance is going to matter. Until DX11 is the baseline API for games, tessellation is still an add-on feature, which means it’s being used to add fine detail to specific models rather than being used on everything in a game world. This demands good tessellation at high factors but at the same time it’s subject to diminishing returns on the improvement to image quality as triangles reach single pixel sizes and smaller. To that end I’m still waiting to see the day where we see tessellation scale similarly to textures – that is by using full MIP chaining of displacement maps – at which point we can evaluate tessellation performance similar to texture performance when it comes to both measuring the performance hit and evaluating the difference in image quality.


404 Comments
View All Comments
Jamahl - Thursday, March 22, 2012 - link
And you were all too willing to do so without evening-up the initial crime. Don't insult our intelligence Ryan.SlyNine - Thursday, March 22, 2012 - link
You need to open your mind alittle bit. It's easy to see what would happen in Anand did something that actually limited out of the box performance.Why are you even suggesting they do such a thing. This is how the card ships, and thats how you will be getting it.
Maybe they should lower the memory clock on AMD cards to make it fair. Or wait, their are different number of shaders. Maybe Anand should somehow limit that.
It just doesn't make any sense.
MattM_Super - Friday, March 23, 2012 - link
Yeah you can't please all the people even some of the time when it comes to GPU reviews. This seems like a through enough review of the card as it comes out of the box. Overclocking is also important, but considering the hassle, increase in temps and noise, and possible voiding of the warranty, it seems unreasonable to demand that the OC scores be treated as more important than the stock scores.Scott314159 - Thursday, March 22, 2012 - link
Any chance of running FAH on the 680... it will only take a few minutes and would give us folders a view into its relative performance compared to the outgoing 580 (and the Radeons).I'm looking to buy a new card in the short term and FAH performance is a factor.
Thanks in advance!
Ryan Smith - Thursday, March 22, 2012 - link
Tried it. It wouldn't run.cudanator - Thursday, March 22, 2012 - link
C'mon guys, why isn't there a single CUDA-Test? And don't say "cause AMD doesn't support it" :P For me most interesting would be the CUDA-Speed compared to other nVidia-Models.Wreckage - Thursday, March 22, 2012 - link
Not to mention PhysX. Sadly there are a lot of features AMD does not support and so they don't get benchmarked often enough. h.264 encoding is another one.CeriseCogburn - Thursday, March 22, 2012 - link
On other sites they turn on full PhysX in Batman on the 680 and keep it off on the 7970, and the 680 still wins.LOL
If you watched the release video they show PhysX now has dynamic on the fly unique in game destruction that is not repeatable - things break apart with unique shatters and cracks. I say "it's a bout time!" to that.
My 7970 needs to go fast, in facts it's almost gone as we speak. No way am I taking the shortbus.
SlyNine - Thursday, March 22, 2012 - link
Umm, the GNC (7xxxHD) has a fixed function H.264 encoder. Afaik the 680GTX doesn't even have a fixed function h.264 encoder. So I'm pretty sure it would mop the floor with cuda H.264 encoding.Ryan Smith - Thursday, March 22, 2012 - link
We have the data, although it's not exactly a great test (a lot of CUDA applications have no idea what to do with Kepler right now). It will be up later today.