The OCZ Octane Review (512GB)
by Anand Lal Shimpi on November 23, 2011 12:00 PM ESTAnandTech Storage Bench 2011
Last year we introduced our AnandTech Storage Bench, a suite of benchmarks that took traces of real OS/application usage and played them back in a repeatable manner. I assembled the traces myself out of frustration with the majority of what we have today in terms of SSD benchmarks.
Although the AnandTech Storage Bench tests did a good job of characterizing SSD performance, they weren't stressful enough. All of the tests performed less than 10GB of reads/writes and typically involved only 4GB of writes specifically. That's not even enough exceed the spare area on most SSDs. Most canned SSD benchmarks don't even come close to writing a single gigabyte of data, but that doesn't mean that simply writing 4GB is acceptable.
Originally I kept the benchmarks short enough that they wouldn't be a burden to run (~30 minutes) but long enough that they were representative of what a power user might do with their system.
Not too long ago I tweeted that I had created what I referred to as the Mother of All SSD Benchmarks (MOASB). Rather than only writing 4GB of data to the drive, this benchmark writes 106.32GB. It's the load you'd put on a drive after nearly two weeks of constant usage. And it takes a *long* time to run.
1) The MOASB, officially called AnandTech Storage Bench 2011 - Heavy Workload, mainly focuses on the times when your I/O activity is the highest. There is a lot of downloading and application installing that happens during the course of this test. My thinking was that it's during application installs, file copies, downloading and multitasking with all of this that you can really notice performance differences between drives.
2) I tried to cover as many bases as possible with the software I incorporated into this test. There's a lot of photo editing in Photoshop, HTML editing in Dreamweaver, web browsing, game playing/level loading (Starcraft II & WoW are both a part of the test) as well as general use stuff (application installing, virus scanning). I included a large amount of email downloading, document creation and editing as well. To top it all off I even use Visual Studio 2008 to build Chromium during the test.
The test has 2,168,893 read operations and 1,783,447 write operations. The IO breakdown is as follows:
| AnandTech Storage Bench 2011 - Heavy Workload IO Breakdown | ||||
| IO Size | % of Total | |||
| 4KB | 28% | |||
| 16KB | 10% | |||
| 32KB | 10% | |||
| 64KB | 4% | |||
Only 42% of all operations are sequential, the rest range from pseudo to fully random (with most falling in the pseudo-random category). Average queue depth is 4.625 IOs, with 59% of operations taking place in an IO queue of 1.
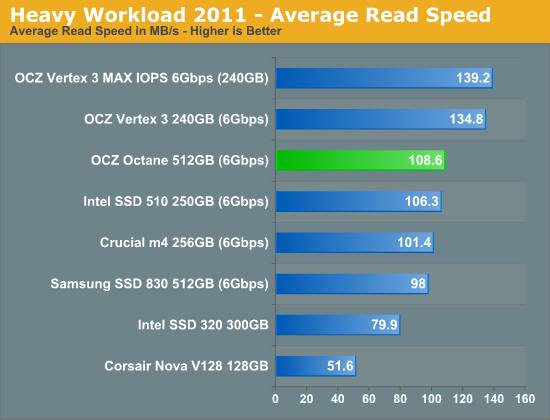
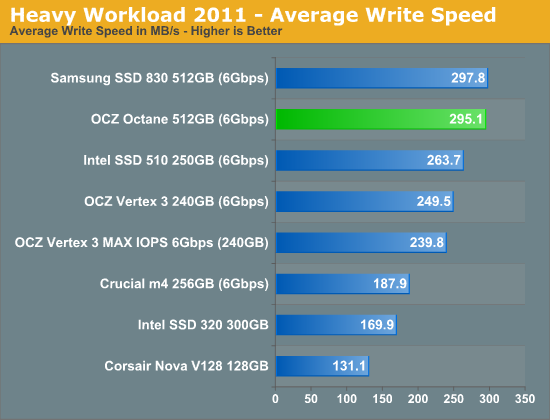
Many of you have asked for a better way to really characterize performance. Simply looking at IOPS doesn't really say much. As a result I'm going to be presenting Storage Bench 2011 data in a slightly different way. We'll have performance represented as Average MB/s, with higher numbers being better. At the same time I'll be reporting how long the SSD was busy while running this test. These disk busy graphs will show you exactly how much time was shaved off by using a faster drive vs. a slower one during the course of this test. Finally, I will also break out performance into reads, writes and combined. The reason I do this is to help balance out the fact that this test is unusually write intensive, which can often hide the benefits of a drive with good read performance.
There's also a new light workload for 2011. This is a far more reasonable, typical every day use case benchmark. Lots of web browsing, photo editing (but with a greater focus on photo consumption), video playback as well as some application installs and gaming. This test isn't nearly as write intensive as the MOASB but it's still multiple times more write intensive than what we were running last year.
As always I don't believe that these two benchmarks alone are enough to characterize the performance of a drive, but hopefully along with the rest of our tests they will help provide a better idea.
The testbed for Storage Bench 2011 has changed as well. We're now using a Sandy Bridge platform with full 6Gbps support for these tests.
AnandTech Storage Bench 2011 - Heavy Workload
We'll start out by looking at average data rate throughout our new heavy workload test:
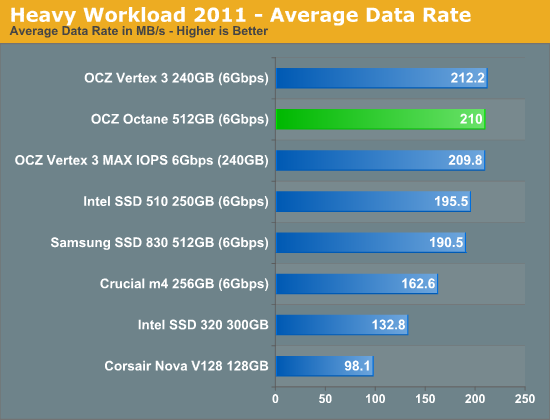
When put to the test the Octane does not disappoint. It's within a couple MB/s of the SF-2281 based Vertex 3, and effectively one of the fastest 6Gbps drives on the market today. I included the old Indilinx Barefoot based Corsair Nova V128 to show just how far Indilinx has come here.
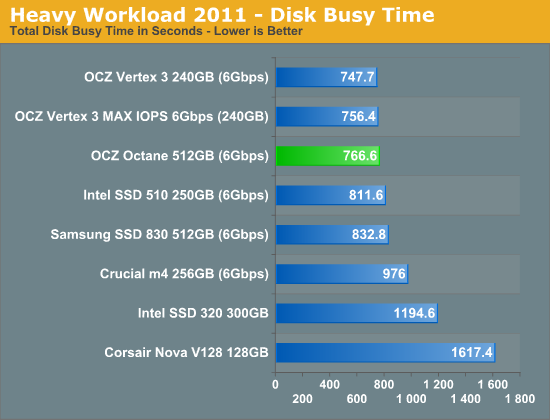
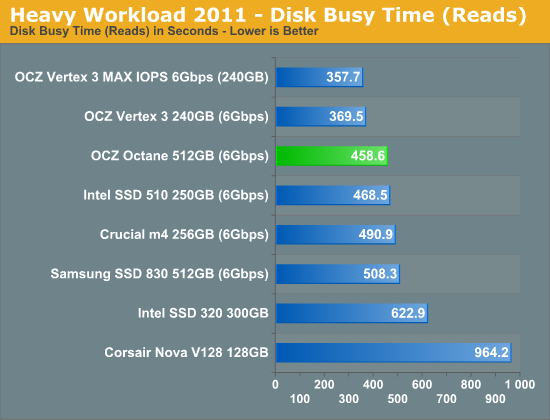
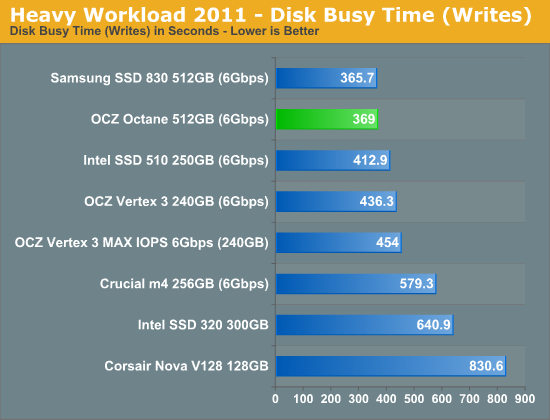
The next three charts just represent the same data, but in a different manner. Instead of looking at average data rate, we're looking at how long the disk was busy for during this entire test. Note that disk busy time excludes any and all idles, this is just how long the SSD was busy doing something:


75 Comments
View All Comments
jwilliams4200 - Wednesday, November 23, 2011 - link
"OCZ sent us a 512GB version with sixteen NAND packages and four 8GB die per package. We typically don't see any interleaving benefits beyond two die per package, so I'd expect similar performance between the 512GB drive and the 256GB version (despite the significant difference in specs)"What a strange thing to say. Do you really mean that you think that despite OCZ quoting a 270MB/s sequential write speed for the 256GB model (vs. 400MB/s for the 512GB model), that the two sizes will actually have the same sequential write speed?
If so, I'd be willing to be a lot of money with you that you are wrong.
jwilliams4200 - Wednesday, November 23, 2011 - link
be -> betAnand Lal Shimpi - Wednesday, November 23, 2011 - link
The only reason I said that is because I wasn't really able to hit OCZ's "400MB/s" in our Iometer tests. Instead I got 280MB/s, which is closer to what OCZ specs the 256GB version at.I'm 100% ok with being wrong and I'll be sure to point it out if I am in the next review :)
Take care,
Anand
jwilliams4200 - Wednesday, November 23, 2011 - link
But you measured 395 MB/s for the 512GB Octane sequential write with AS-SSD.It seems that the Octane sequential write speed varies a lot (other review sites have measured 348 MB/s with AS-SSD). Maybe it depends a lot on the block size, or on the size of the test file (span), or on whether the SSD is in a used or fresh state.
Anand Lal Shimpi - Wednesday, November 23, 2011 - link
But if you look at HDTach and Iometer the perf is down at 280MB/s. I'm not entirely sure what's going on with AS-SSD...Take care,
Anand
gevorg - Wednesday, November 23, 2011 - link
"I believe OCZ needs a good 12 months of an Intel or Samsung-like track record to really build confidence in its products."I completely agree!!
LoneWolf15 - Thursday, November 24, 2011 - link
""I believe OCZ needs a good 12 months of an Intel or Samsung-like track record to really build confidence in its products."I completely agree!! "
That makes three of us. I'll say one more --they also need to build a proven track record of customer service as well.
Right now, Intel, Crucial (specifically the m4), and Samsung are the choices I look at if a client needs an SSD.
MrSpadge - Wednesday, November 23, 2011 - link
What's this "double write endurance" and "faster boot" about?MrS
iwod - Wednesday, November 23, 2011 - link
I think it just shows how Random Read is EXTREMELY important to Real world workloads.Since we have already establish Random Write over 40 - 50MB/s doesn't make any difference, And Seq Read Write matter a lot less then Random Read.
Taft12 - Wednesday, November 23, 2011 - link
Fully agree here, in fact random read is the only thing that really matters as far as anything you'd ever notice in real world desktop use.Anything more is benchmark porn (no offense to the fetishes of many AT readers)
Longevity and stability is most important by far, too bad a benchmark can't determine that.