Dell XPS 15 L502x: Now with Sandy Bridge
by Jarred Walton on April 20, 2011 1:10 AM ESTNo Surprises: Quad-Core Sandy Bridge Is Still Fast
We’ve already looked at the i7-2630QM when we reviewed the ASUS G73SW and previewed the MSI GT680R. The difference here is that we’re not looking at a 15.6” chassis that’s lighter and thinner than the GT680R, and we’re pairing the CPU with a GT 540M instead of a GTX 460M. For applications, the GPU generally won’t matter, but the presence of Optimus Technology will definitely help in several areas: better battery life, and access to Intel’s Quick Sync for video transcoding. We’ll do a quick check of performance with Quick Sync in a moment.
For the charts, we’re sticking mostly with mainstream laptops. We’ve had plenty systems come through our tests in the past year that meet that classification, and you can make your own comparisons using Mobile Bench. For our applications charts, we’ve got quite a few Arrandale systems and a couple Sandy Bright units, with a smattering of GPUs ranging from IGP (HD 3000) up through GTX 460M. Given the pricing, the XPS 15 will mostly be playing in the $1000+ market, and our test system is very close to the price of laptops like the MSI GT680R and ASUS G73SW, so we’ll include the latter to show where the next performance tier lies. At the other end of the performance and pricing scale, we’re also including an AMD Brazos E-350 laptop, the HP dm1z. It’s not at all in competition with the other laptops—from either a price or performance standpoint—but it does offer plenty of battery life in an affordable package and we liked it enough to give it our Silver Editors’ Choice award.
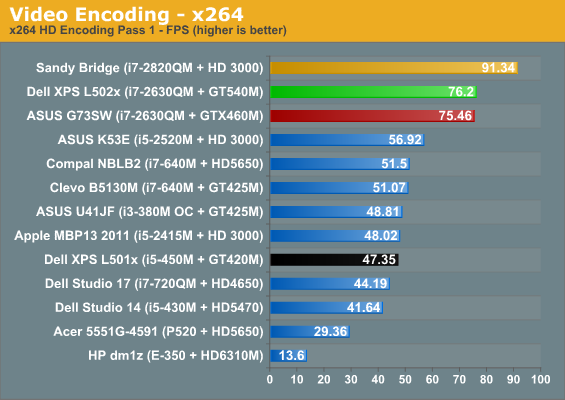
The laptops we’ve chosen to highlight in this review are the Dell XPS L501x and L502x, in black and green, showing how the SNB update compares to the original. The ASUS G73SW is in red, showing where a faster GPU will get you, and the Sandy Bridge i7-2820QM with an SSD is in gold, providing the reverse picture: more CPU performance and a fast storage subsystem, but with a much slower IGP.
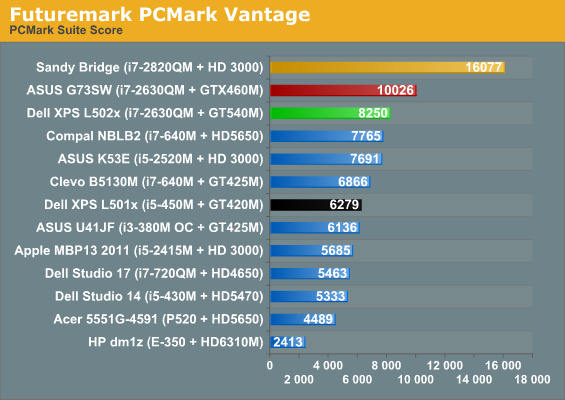
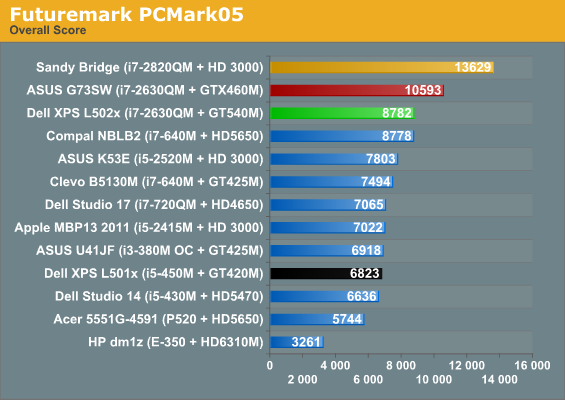
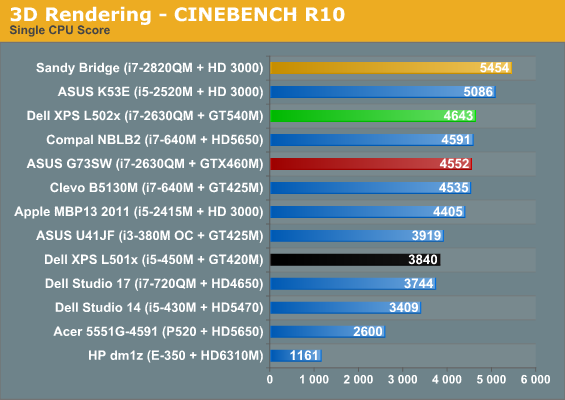
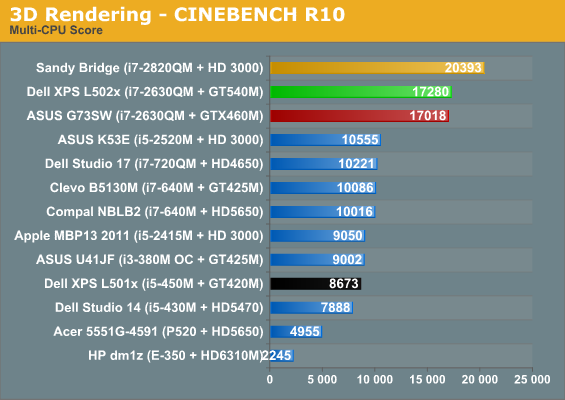
PCMark always likes a fast storage subsystem, and it does give you some idea of how much more responsive a laptop can feel with a good SSD. The Sandy Bridge i7-2820QM ends up nearly twice as fast as the XPS 15 in PCMark Vantage, and 55% faster in the old PCMark05. PCMark also stresses the GPU a bit, which is why the ASUS G73SW ends up around 20% faster than the L502x. Overall, the i7-2820QM with SSD is 37% faster than the L502x and the ASUS G73SW is just 7% faster. The L502x ends up as the third fastest laptop in our application tests, and the only other laptop that manages to squeak by with a lead in the individual results is in the single-core Cinebench test, where the higher single-core Turbo of the K53E/i5-2520M wins out over core count.
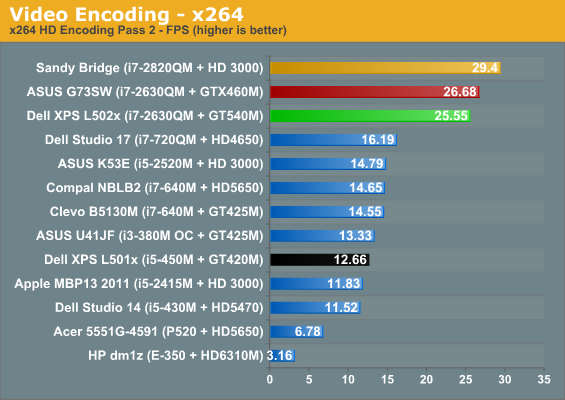
Comparing to the original XPS 15 L501x is a bit easier, since all of the main components are at least somewhat faster on the L502x but still similar in specs. The result is performance that’s 20% to 100% faster than the L501x, with the 100% increases coming in the highly threaded Cinebench and Second Pass x264 encoding tests. On average, the L502x is 57% faster than the L501x, though for more mundane office/Internet workloads it’s probably more like 30% faster.
As noted above, we also did some tests of GPU accelerated video transcoding. We used CyberLink’s MediaEspresso and transcoded a 5323 frame 1080p24 video into 720p YouTube format using just the CPU, then with the GT 540M active, and finally using Quick Sync (i.e. HD 3000 active). With Quick Sync, MediaEspresso now has two encoding profiles available, fast and quality, so we tried both. In terms of performance, the CPU alone took 92 seconds, for a final speed of 58FPS. With the GT 540M, performance improved to 69 seconds/77FPS. Finally, Quick Sync with the “Quality” profile took 34 seconds (157FPS), while the “Fast” profile results in the quickest transcoding time, requiring just 25 seconds—or a very impressive speed of 213FPS.
As far as the transcoding quality, subjectively none of the encodes were all that great, showing a clear loss of fidelity from the original 1080p24 source—though that’s expected, considering the final file size was about 10% of the original. I also didn’t notice the issues we saw on CUDA encoding, but the home video I used may not be the best for picking out such details. (We noticed the problems originally on Arcsoft’s Total Media Converter, so it was likely just their implementation of CUDA transcoding rather than a general problem with CUDA, and the latest version might have fixed things.) A final interesting point to mention is that right now, NVIDIA’s Optimus Technology detects MediaEspresso and by default uses the discrete GPU, even though Intel’s Quick Sync is more than twice as fast. Thankfully that you can modify the profile to prefer Intel’s IGP—and on Arrandale’s IGP the dGPU would be preferable—but at present it doesn’t look like NVIDIA’s profiles are smart enough to detect your IGP and determine what path is optimal. That could be a problem down the road when Ivy Bridge and future IGPs continue to improve performance, but hopefully software updates will address the concern.
Okay, that’s enough talk about general application performance. Let’s see how the L502x fares in synthetic graphics performance before we get to the games.
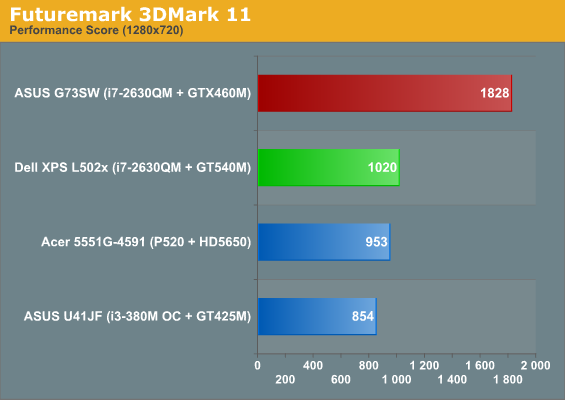
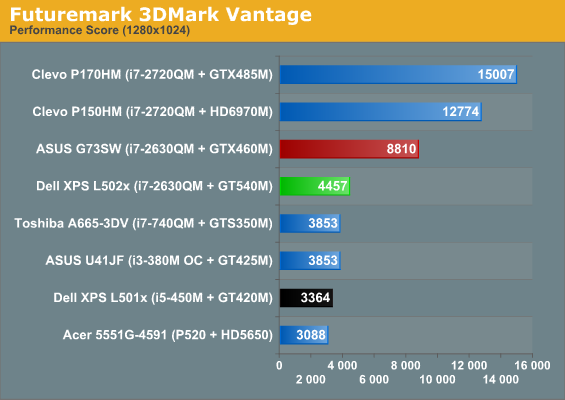
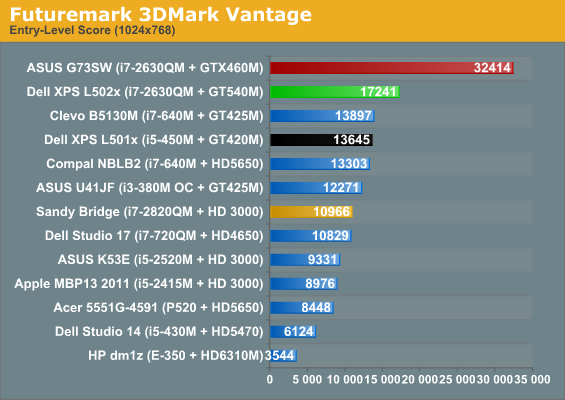
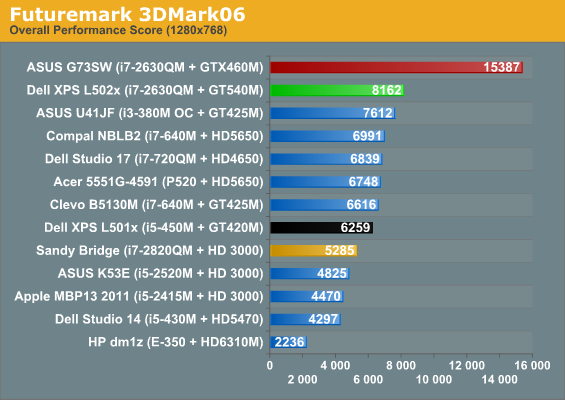
We’re updating our 3DMark charts to focus more on modern workloads, so we’ve added 3DMark 11’s Performance default to our benchmark list, and we’ve included results for 3DMark Vantage’s Performance setting as well—though we don’t have results for all of the other laptops on those charts. We’re also skipping the charts for 3DMark03/05, though you can still see the results in Bench.
Interesting to note is that the 3DMark 11 Performance test appears to be almost entirely GPU limited, as even with a P520 processor the HD 5650 comes out 12% ahead of the GT 425M (and the 540M in turn is 7% faster than the 5650). Depending on how well that comparison holds up, the GTX 460M looks to be around 80% faster than the GT 540M. On paper, the GTX 460M has 101% more computational power and 108% more bandwidth than the 540M, so realizing an 80% performance increase would be about right.
Elsewhere, what we see is a familiar pattern: all of the GT 400M/500M and HD 5650 parts cluster near each other, with the XPS L502x generally coming out on top. The problem is the huge gulf between the GT 540M and the GTX 460M we just mentioned, never mind the top performing mobile GPUs like the HD 6970M and GTX 485M. So once again, this is a decidedly midrange mobile GPU that will struggle with modern games at higher quality settings and higher resolutions—which is what we’ll see next. As far as upgrades from the Arrandale platform, thanks to the increased GPU bandwidth and faster core clocks, plus the quad-core SNB CPU, the new L502x is around 25-35% faster than the old L501x in the 3DMark results. Now let’s find out if that same margin of victory holds in actual games.


76 Comments
View All Comments
SeanPT - Wednesday, April 20, 2011 - link
They really need to bring back the design of the XPS M1330. That was one heck of a laptop and I still have a handful of them in service. There were a few nagging design flaws but the later revisions didn't suffer from the same problems. I ordered one the day it was launched with that nice LED display that was just oh so thin.XZerg - Wednesday, April 20, 2011 - link
I own a L501x that I bought in December 2010 after reading the review at AnandTech and the awesome deal I was able to get. However upon receiving it I was in for some disappointments:1) No Port Replicator ports
2) Changing the HDD was pretty much rip the whole damn system apart
3) Keys arrangement - they could have easily put the arrow keys a bit south or something to give a hint as you are more likely to press wrong key many times when trying to use Shift, Right-click key, End.
4) The touchpad is annoying - if you have a finger/hand close to the touchpad it treats it pressing the touchpad - so either no response to the actual action with the other hand or tries to zoom or scroll instead.
5) The screen only tilts to something like 120degrees or so which is annoying sometimes when you want have better viewing angle due to too much reflection due to the glossy screen.
6) Finally I would have much rather had the multimedia buttons standalone instead of FN based.
Pessimism - Wednesday, April 20, 2011 - link
Snap together plastic clip construction=FAIL. No serviceability whatsoever. That stuff NEVER comes apart without something breaking.XZerg - Wednesday, April 20, 2011 - link
yea and even if it does come apart it does not go back in perfectly either. I have the l501x and i know that for sure.I have to say though I like the l501x over the l502x simply because of the keyboard on the newer one feels cheap quality.
Arbie - Wednesday, April 20, 2011 - link
Whether the goal is to show what the machine can do, or to show what it can't do, this game matters. First, there's a huge amount of comparative info available. Second, Crysis / Warhead scaled really well so you probably can get a playable experience at the lower settings a box like this works with. Third it's the best single-player FPS ever made (IMHO) and won't be surpassed anytime soon - unfortunately. So it deserves a continued place on your list. Stalker...? C'mon.NCM - Wednesday, April 20, 2011 - link
JW writes: "Finally, Quick Sync with the “Quality” profile took 34 seconds (156.56 FPS), while the “Fast” profile results in the quickest transcoding time, requiring just 25 seconds—or a very impressive speed of 212.92 FPS."So test results apparently timed to the nearest second acquire 5 significant digit precision when translated into FPS? My old math teacher wouldn't buy that one...
JarredWalton - Wednesday, April 20, 2011 - link
Perhaps I used a stopwatch and rounded to the nearest second? :-pAnyway, you'll be thrilled to know that I have now rounded to the nearest FPS, which completely changes the results. Oh, wait... it doesn't, other than to show there's potentially a larger margin of error. Maybe I should round to two significant digits, because then we could say that it was 58FPS vs. 77FPS vs. 160FPS vs. 210FPS -- and by further rounding increase the margin of error another 1-5%.
I've actually considered this before. All of the gaming benchmarks are slightly variable, so while they can measure very specifically the result of one test run, depending on the game you might see up to a 10% change between runs. It's why I end up running multiple times and taking the best result, so we're comparing best-case on all systems. But should we stop including any decimal points in our game benchmarks, just because they're variable? Some readers will complain if a bunch of systems tie at, e.g. 73FPS, but at the same time I hope everyone here realizes that anything less than a 5% difference is close enough that you're not going to notice.
BioTurboNick - Wednesday, April 20, 2011 - link
As a scientist, I'd say average +/- standard deviation would be perfect. :-Dseapeople - Wednesday, April 20, 2011 - link
Three sig figs is fine. It's just distracting and annoying to look at "155.36 fps". Whatever you do, do NOT start doing crap like "46 +/- 3 fps" like someone suggested. This is a tech forum, not a statistics orgy; the average audience here wouldn't care.tipoo - Wednesday, April 20, 2011 - link
Is it so hard to design a laptop with a 9 cell that doesn't stick out like a sore thumb?