The Intel SSD 510 Review
by Anand Lal Shimpi on March 2, 2011 1:23 AM EST- Posted in
- IT Computing
- Storage
- SSDs
- Intel
- Intel SSD 510
TRIM Performance
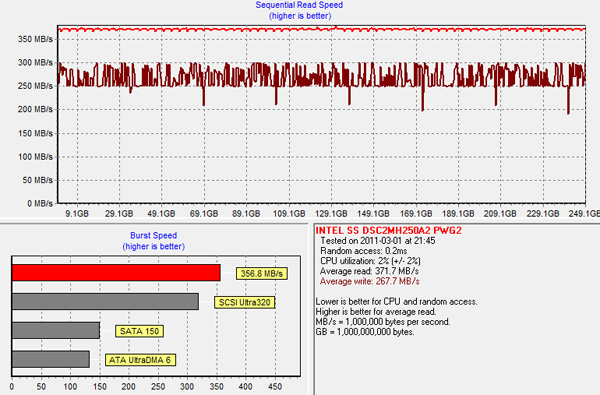
As expected, Intel's SSD 510 fully supports the ATA TRIM instruction. To gauge it's implementation I filled the 510 with data then ran a 4KB random write test (QD=32, 100% LBA space) for 20 minutes and measured performance using ATTO. I then TRIMed the entire drive by formatting it in Windows 7 and re-ran the ATTO test. The graphs below show clean, torture and and after TRIM performance.
First clean performance:
Next, after our torture session:
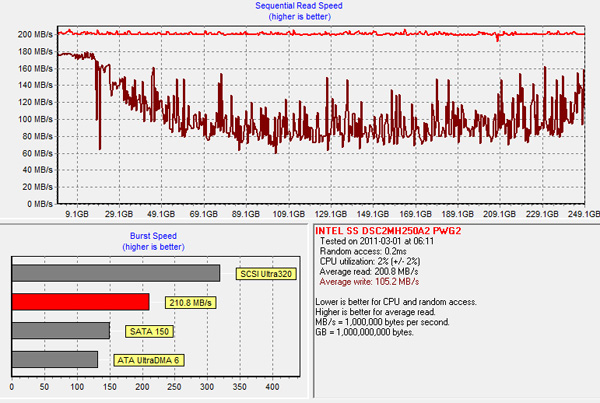
Once tortured the 510's performance drops as far down as 60MB/s for writes. A single TRIM pass restores performance to an almost-new state:
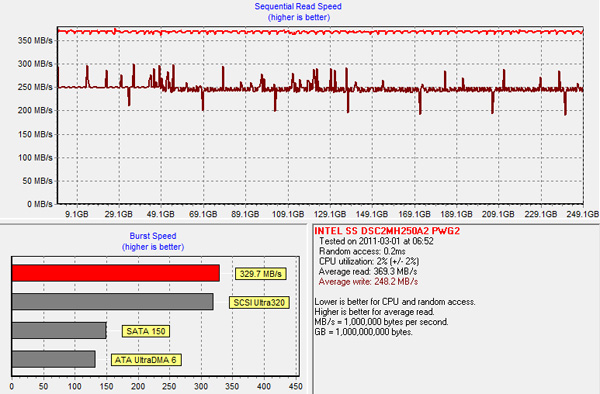
Worst case sequential performance isn't terrible, but worst case random write performance is pretty bad. Remember the ~50MB/s speeds from earlier? Those will drop down to ~5MB/s with an adequately fragmented drive. TRIM will recover performance but write amplification goes through the roof if you have a highly random workload. The 510 is suitable for desktop workloads, but anything more enterprise-like may be out of the question (at least not without significantly increasing the amount of spare area). I'm currently testing the 510 in a Mac to see how performance fares without TRIM over time.


128 Comments
View All Comments
masterkritiker - Wednesday, March 2, 2011 - link
When will we be able to buy $100+ SSDs @ 1TB capacity?gammaray - Wednesday, March 2, 2011 - link
nevertno - Thursday, March 3, 2011 - link
+1Nihility - Thursday, March 3, 2011 - link
At least 4 years.ionis - Wednesday, March 2, 2011 - link
It would be nice if some HDDs were also included in workload benches. They were in the random read/write benches so I don't get why they were left out of the other ones.dagamer34 - Wednesday, March 2, 2011 - link
HDDs aren't included because they'd throw off the scale pretty horribly. The number labeling the performance would be larger than the bar itself compared to all the other SSDs out there.ionis - Thursday, March 3, 2011 - link
I find that hard to believe, considering they were included in the random read/write graphs at 1/100 or less of the performance of some of the SSDs and the charts weren't scaled horribly.In the sequential reads/writes, they performed at 25%-80% which doesn't through the scale off much at all.
The heavy workload looked to involve a lot of sequential access (installs and downloads). So again, I don't see why they weren't included.
There are also other comments asking for more HDDs in the benches. For people like myself, who didn't start following storage benchmarks until SSDs came out, it's hard to tell what the performance gain is.
ionis - Thursday, March 3, 2011 - link
I find that hard to believe, considering they were included in the random read/write graphs at 1/100 or less of the performance of some of the SSDs and the charts weren't scaled horribly.In the sequential reads/writes, they performed at 25%-80% which doesn't throw the scale off much at all.
The heavy workload looked to involve a lot of sequential access (installs and downloads). So again, I don't see why they weren't included.
There are also other comments asking for more HDDs in the benches. For people like myself, who didn't start following storage benchmarks until SSDs came out, it's hard to tell what the performance gain is.
(sorry if double post, comment didn't seem to show up 1st time)
mateus1987 - Wednesday, March 2, 2011 - link
now you know.http://nzealander.blog.com/files/2011/03/6661.jpg
mateus1987 - Wednesday, March 2, 2011 - link
the satanic Apple logo.http://nzealander.blog.com/files/2011/03/6661.jpg