The Intel SSD 510 Review
by Anand Lal Shimpi on March 2, 2011 1:23 AM EST- Posted in
- IT Computing
- Storage
- SSDs
- Intel
- Intel SSD 510
Performance vs. Transfer Size
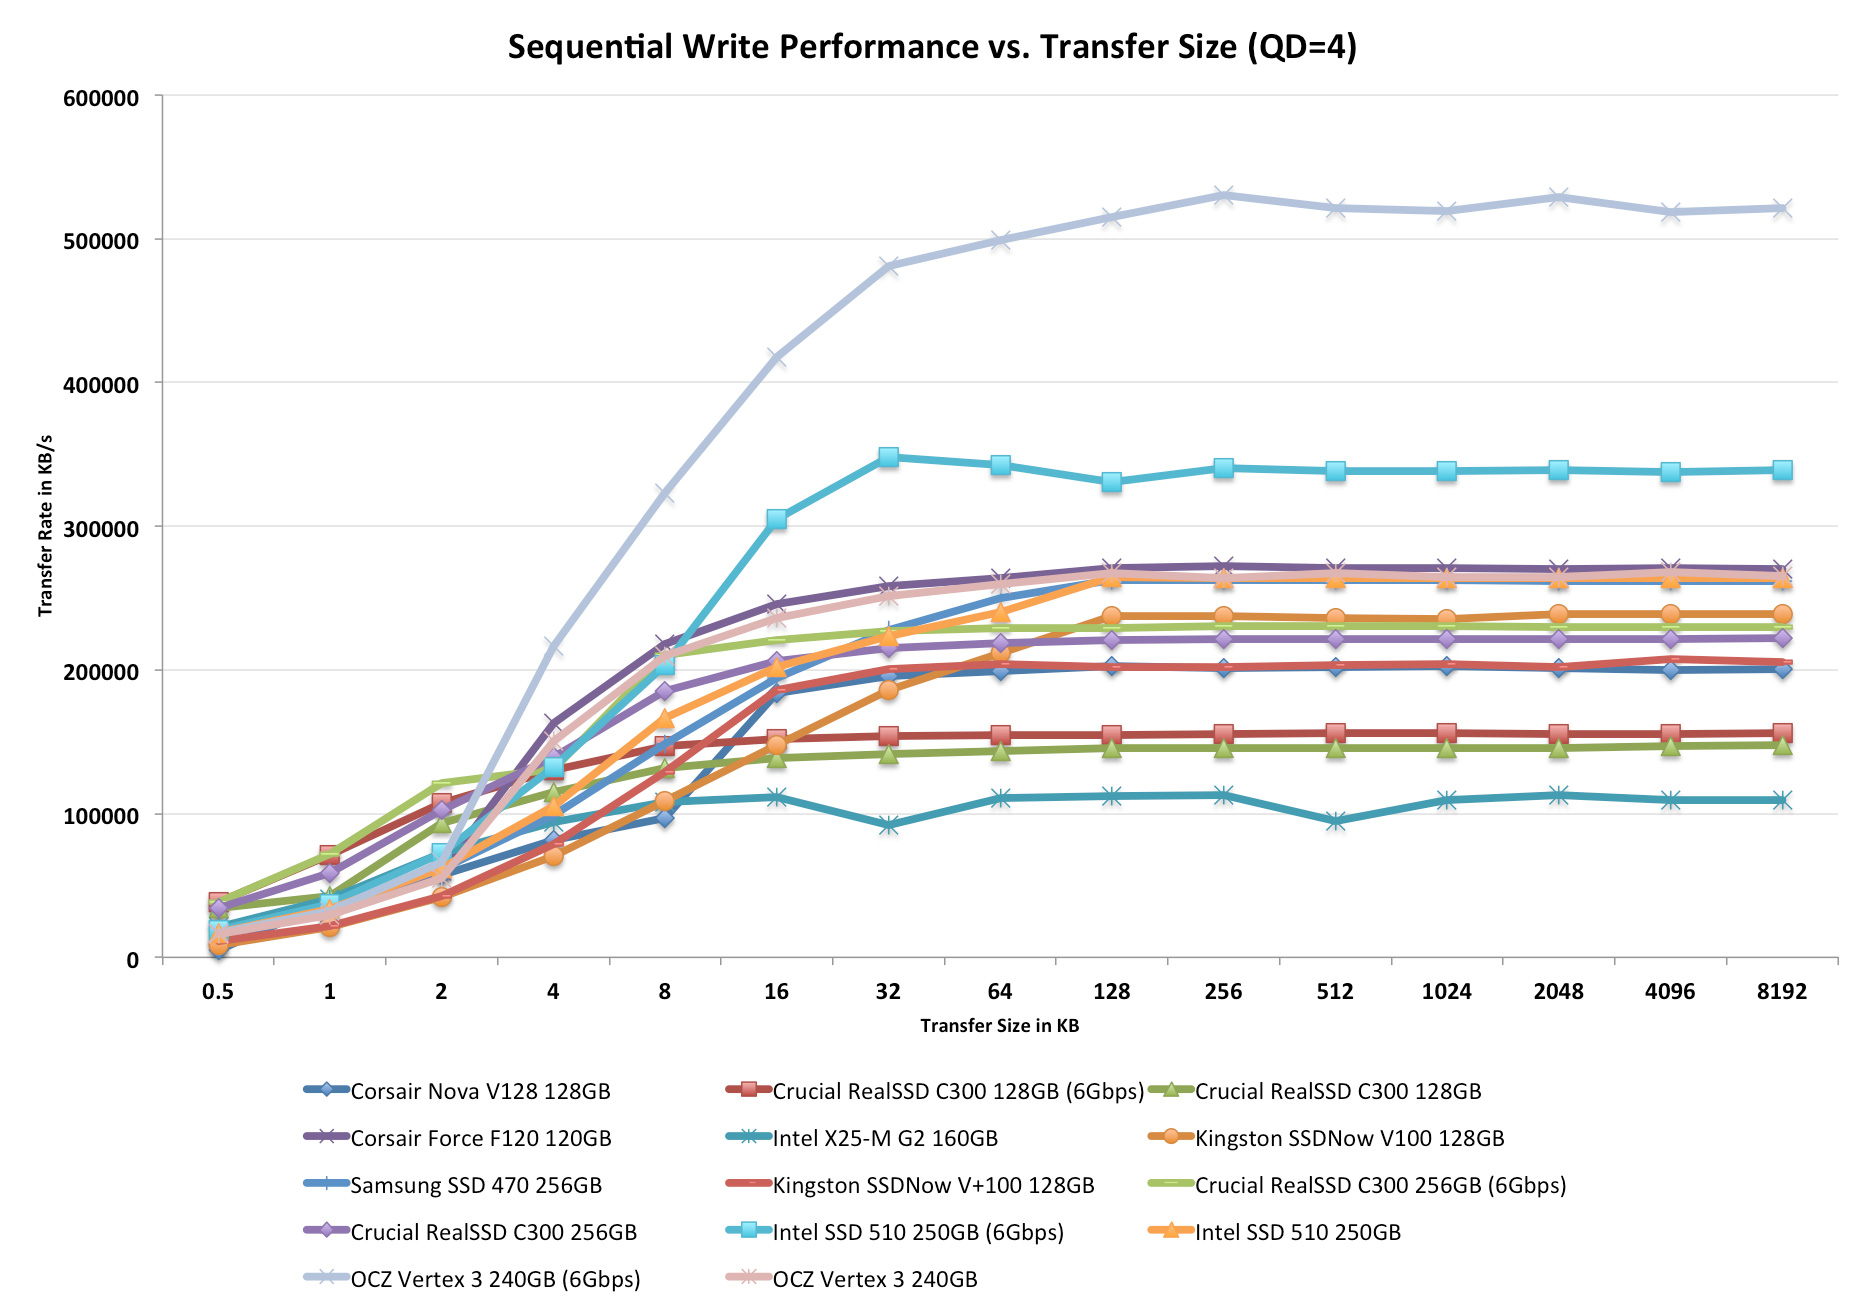
All of our Iometer sequential tests happen at a queue depth of 1, which is indicative of a light desktop workload. It isn't too far fetched to see much higher queue depths on the desktop. The performance of these SSDs also greatly varies based on the size of the transfer. For this next test we turn to ATTO and run a sequential write over a 2GB span of LBAs at a queue depth of 4 and varying the size of the transfers.

It's very interesting to note how Intel's performance curve mimics that of the Vertex 3 down to the slight performance tradeoff at smaller transfer sizes. The RealSSD C300, despite being based on effectively the same controller as the Intel SSD 510, achieves much better small file sequential read speed. Intel/SF's optimization point likely makes more sense here however as sequential transfers generally happen at larger sizes (typically at 128KB).
At 128KB the Intel SSD 510 is slightly faster than OCZ's Vertex 3.
Write speed with fully compressible data is easily a victory for the SF-2200 based OCZ Vertex 3.


128 Comments
View All Comments
masterkritiker - Wednesday, March 2, 2011 - link
When will we be able to buy $100+ SSDs @ 1TB capacity?gammaray - Wednesday, March 2, 2011 - link
nevertno - Thursday, March 3, 2011 - link
+1Nihility - Thursday, March 3, 2011 - link
At least 4 years.ionis - Wednesday, March 2, 2011 - link
It would be nice if some HDDs were also included in workload benches. They were in the random read/write benches so I don't get why they were left out of the other ones.dagamer34 - Wednesday, March 2, 2011 - link
HDDs aren't included because they'd throw off the scale pretty horribly. The number labeling the performance would be larger than the bar itself compared to all the other SSDs out there.ionis - Thursday, March 3, 2011 - link
I find that hard to believe, considering they were included in the random read/write graphs at 1/100 or less of the performance of some of the SSDs and the charts weren't scaled horribly.In the sequential reads/writes, they performed at 25%-80% which doesn't through the scale off much at all.
The heavy workload looked to involve a lot of sequential access (installs and downloads). So again, I don't see why they weren't included.
There are also other comments asking for more HDDs in the benches. For people like myself, who didn't start following storage benchmarks until SSDs came out, it's hard to tell what the performance gain is.
ionis - Thursday, March 3, 2011 - link
I find that hard to believe, considering they were included in the random read/write graphs at 1/100 or less of the performance of some of the SSDs and the charts weren't scaled horribly.In the sequential reads/writes, they performed at 25%-80% which doesn't throw the scale off much at all.
The heavy workload looked to involve a lot of sequential access (installs and downloads). So again, I don't see why they weren't included.
There are also other comments asking for more HDDs in the benches. For people like myself, who didn't start following storage benchmarks until SSDs came out, it's hard to tell what the performance gain is.
(sorry if double post, comment didn't seem to show up 1st time)
mateus1987 - Wednesday, March 2, 2011 - link
now you know.http://nzealander.blog.com/files/2011/03/6661.jpg
mateus1987 - Wednesday, March 2, 2011 - link
the satanic Apple logo.http://nzealander.blog.com/files/2011/03/6661.jpg