The Intel SSD 510 Review
by Anand Lal Shimpi on March 2, 2011 1:23 AM EST- Posted in
- IT Computing
- Storage
- SSDs
- Intel
- Intel SSD 510
AnandTech Storage Bench 2010
To keep things consistent we've also included our older Storage Bench. Note that the old storage test system doesn't have a SATA 6Gbps controller, so we only have one result for the 6Gbps drives.
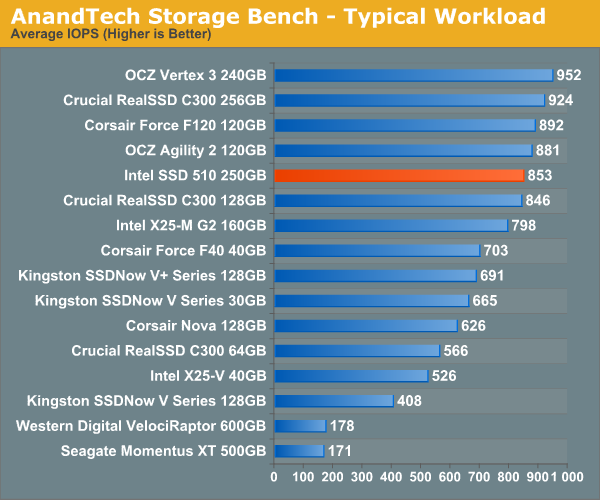
The first in our benchmark suite is a light/typical usage case. The Windows 7 system is loaded with Firefox, Office 2007 and Adobe Reader among other applications. With Firefox we browse web pages like Facebook, AnandTech, Digg and other sites. Outlook is also running and we use it to check emails, create and send a message with a PDF attachment. Adobe Reader is used to view some PDFs. Excel 2007 is used to create a spreadsheet, graphs and save the document. The same goes for Word 2007. We open and step through a presentation in PowerPoint 2007 received as an email attachment before saving it to the desktop. Finally we watch a bit of a Firefly episode in Windows Media Player 11.
There’s some level of multitasking going on here but it’s not unreasonable by any means. Generally the application tasks proceed linearly, with the exception of things like web browsing which may happen in between one of the other tasks.
The recording is played back on all of our drives here today. Remember that we’re isolating disk performance, all we’re doing is playing back every single disk access that happened in that ~5 minute period of usage. The light workload is composed of 37,501 reads and 20,268 writes. Over 30% of the IOs are 4KB, 11% are 16KB, 22% are 32KB and approximately 13% are 64KB in size. Less than 30% of the operations are absolutely sequential in nature. Average queue depth is 6.09 IOs.
The performance results are reported in average I/O Operations per Second (IOPS):
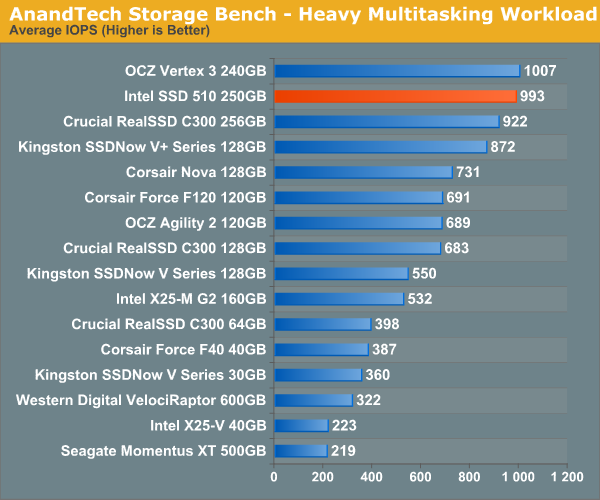
If there’s a light usage case there’s bound to be a heavy one. In this test we have Microsoft Security Essentials running in the background with real time virus scanning enabled. We also perform a quick scan in the middle of the test. Firefox, Outlook, Excel, Word and Powerpoint are all used the same as they were in the light test. We add Photoshop CS4 to the mix, opening a bunch of 12MP images, editing them, then saving them as highly compressed JPGs for web publishing. Windows 7’s picture viewer is used to view a bunch of pictures on the hard drive. We use 7-zip to create and extract .7z archives. Downloading is also prominently featured in our heavy test; we download large files from the Internet during portions of the benchmark, as well as use uTorrent to grab a couple of torrents. Some of the applications in use are installed during the benchmark, Windows updates are also installed. Towards the end of the test we launch World of Warcraft, play for a few minutes, then delete the folder. This test also takes into account all of the disk accesses that happen while the OS is booting.
The benchmark is 22 minutes long and it consists of 128,895 read operations and 72,411 write operations. Roughly 44% of all IOs were sequential. Approximately 30% of all accesses were 4KB in size, 12% were 16KB in size, 14% were 32KB and 20% were 64KB. Average queue depth was 3.59.
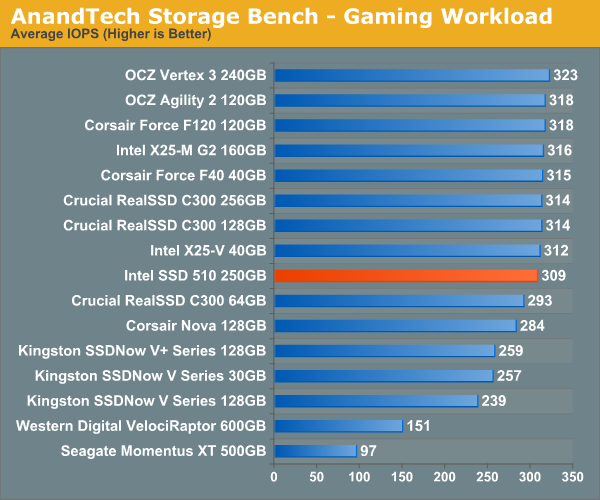
The gaming workload is made up of 75,206 read operations and only 4,592 write operations. Only 20% of the accesses are 4KB in size, nearly 40% are 64KB and 20% are 32KB. A whopping 69% of the IOs are sequential, meaning this is predominantly a sequential read benchmark. The average queue depth is 7.76 IOs.


128 Comments
View All Comments
7Enigma - Wednesday, March 2, 2011 - link
Like Anand I'm shocked Intel went this route. After touting the random read/write so heavily (and for good reason) they pull this stunt and look horrible. I'm an owner of an 80gig G2 and love it but have been in the process of justifying an upgrade so I can put the 80gig in my laptop. I'm willing to sacrifice a bit of sequential performance (just like I did with the G2 over other competitors), but this is a complete step backwards.And remember the review unit was the larger drive. Put the 120gig version in those benchmarks and the critical numbers that are so low to start with are only going to become much worse. Just like all of the previous releases due to high cost the majority of people will be purchasing the smaller-sized drives (most people bought Intel 80gig when 160gig was out, etc.).
When you are competing on firmware only, and that firmware is not the best to begin with (in comparison to Sandforce), you have to be perfect, and in this case Intel just didn't produce.
Very disappointed indeed.
Concillian - Wednesday, March 2, 2011 - link
"After touting the random read/write so heavily (and for good reason) they pull this stunt and look horrible."They don't look horrible, they are 2nd or 1st in most of the real world tests, Improving on the G2 performance.
Random performance is lower, but the real world tests demonstrate that random performance has reached a point where it is "enough" for typical workloads.
semo - Wednesday, March 2, 2011 - link
Whose real world are we talking about here? Average Joe "real world", mainstream "real world", enthusiast "real world"... you get the idea.As an average user (net browsing, office apps, flash gaming, etc...) this sort of performance is great. However, the same user would benefit just as much from a much cheaper 60GB SSD. The 510 is neither cheap overall or in $/GB sense. My "real world" is using VMs and lot's of tests involving high QDs and IOPS so this drive is not for me... At that price, capacity and performance, I don't know who this drive is for.
TEAMSWITCHER - Wednesday, March 2, 2011 - link
It's a bit surprising that the Crucial C300 (on the 6 GB/s) interface did so well in the real world benchmarks. This drive is a year old and still competitive. Newegg had them on sale a couple weeks ago for only $480.00. Which is a bargain compared to the $615.00 for the Intel 510. This is an interesting technology to watch, with lots of plot twists and upsets. I can't wait to see the crucial M4.Lonesloane - Wednesday, March 2, 2011 - link
I see the price point of the new Intel 510 drives extremely critical. Intel have always charged more than the competition and got away with it due to the fact that on the other hand there was the good quality, compatibility and reliablity of their SSD products.Now it seems like a clear win for Sandforce, especially if we take the superior write amplification of the sandforce controller, which is a big advantage regarding the reduced write cycles of the new 25nm NAND.
Shadowmaster625 - Wednesday, March 2, 2011 - link
You have to tell them to stop sending you Ferraris because no one buys Ferraris. The 120GB versions of both the OCZ and Intel drives are much more relevant, and we dont have the foggiest clue how they line up. And even if we did, we would not know how the 40/60/80 GB versions stack up against each other. I am currently shopping for a 40-60GB SSD and I cannot even to this day get a clear answer on which product is better (performance per dollar). And all of these drives have been out for at least year....7Enigma - Wednesday, March 2, 2011 - link
Exactly. I posted above about this and it will seriously hurt Intel as the poor random read/write will only become worse.Concillian - Wednesday, March 2, 2011 - link
"I am currently shopping for a 40-60GB SSD and I cannot even to this day get a clear answer on which product is better (performance per dollar). And all of these drives have been out for at least year.... "This is a concern and all you really need to know is how they reduce capacity.
They can do it by reducing the number of chips (usually will see a performance hit)
or
They can do it by using the same number of chips, but each stores less (usually will perform about the same)
When you look at the OCZ 25nm "debacle" it was this very decision that created the issue. The 25nm flash itself was not the problem (even though that got a fair bit of the blame)... it was how they implemented it. They used half the 25nm higher density chips in the drives, reducing performance. This also meant reserving one block for over-provision meant it was larger in size, so that ate into the usable capacity. The solution still uses 25nm chips, but they're the same number of chips as 34nm, so they perform at about the same level.
There probably needs to be a chart at the beginning like the video card articles showing details for each drive. It would clear up any issues, as well as something that can be referred to in the future. I refer to the old video card reviews when looking for things like ROP / texture counts, memory bandwidth, speeds, etc... because those charts have really useful information in them.
jnmfox - Wednesday, March 2, 2011 - link
+1We need a round-up of OS boot drives (40/60/80 GB). I love my 80GB G2 but I’m not interested in paying more than $200, hopefully less, for an SSD.
Stargrazer - Wednesday, March 2, 2011 - link
I too would love to see the numbers for the 128(-ish) GB versions.