The Intel SSD 510 Review
by Anand Lal Shimpi on March 2, 2011 1:23 AM EST- Posted in
- IT Computing
- Storage
- SSDs
- Intel
- Intel SSD 510
AnandTech Storage Bench 2010
To keep things consistent we've also included our older Storage Bench. Note that the old storage test system doesn't have a SATA 6Gbps controller, so we only have one result for the 6Gbps drives.
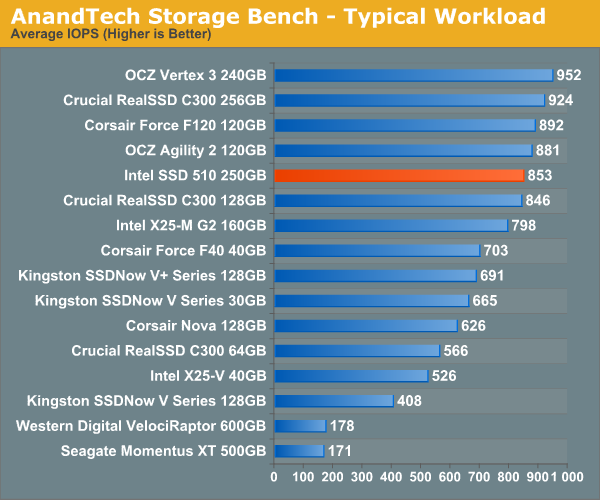
The first in our benchmark suite is a light/typical usage case. The Windows 7 system is loaded with Firefox, Office 2007 and Adobe Reader among other applications. With Firefox we browse web pages like Facebook, AnandTech, Digg and other sites. Outlook is also running and we use it to check emails, create and send a message with a PDF attachment. Adobe Reader is used to view some PDFs. Excel 2007 is used to create a spreadsheet, graphs and save the document. The same goes for Word 2007. We open and step through a presentation in PowerPoint 2007 received as an email attachment before saving it to the desktop. Finally we watch a bit of a Firefly episode in Windows Media Player 11.
There’s some level of multitasking going on here but it’s not unreasonable by any means. Generally the application tasks proceed linearly, with the exception of things like web browsing which may happen in between one of the other tasks.
The recording is played back on all of our drives here today. Remember that we’re isolating disk performance, all we’re doing is playing back every single disk access that happened in that ~5 minute period of usage. The light workload is composed of 37,501 reads and 20,268 writes. Over 30% of the IOs are 4KB, 11% are 16KB, 22% are 32KB and approximately 13% are 64KB in size. Less than 30% of the operations are absolutely sequential in nature. Average queue depth is 6.09 IOs.
The performance results are reported in average I/O Operations per Second (IOPS):
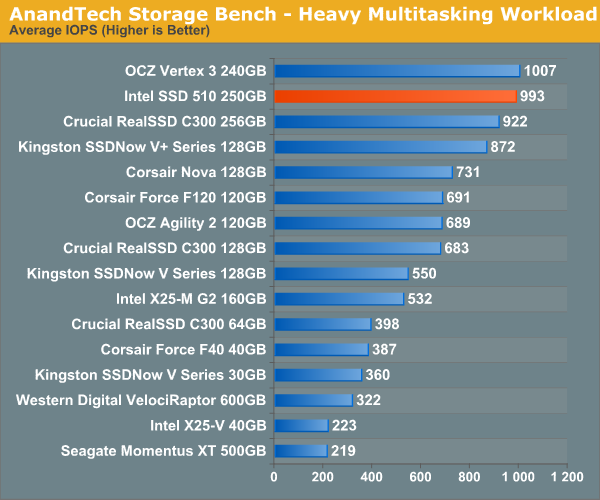
If there’s a light usage case there’s bound to be a heavy one. In this test we have Microsoft Security Essentials running in the background with real time virus scanning enabled. We also perform a quick scan in the middle of the test. Firefox, Outlook, Excel, Word and Powerpoint are all used the same as they were in the light test. We add Photoshop CS4 to the mix, opening a bunch of 12MP images, editing them, then saving them as highly compressed JPGs for web publishing. Windows 7’s picture viewer is used to view a bunch of pictures on the hard drive. We use 7-zip to create and extract .7z archives. Downloading is also prominently featured in our heavy test; we download large files from the Internet during portions of the benchmark, as well as use uTorrent to grab a couple of torrents. Some of the applications in use are installed during the benchmark, Windows updates are also installed. Towards the end of the test we launch World of Warcraft, play for a few minutes, then delete the folder. This test also takes into account all of the disk accesses that happen while the OS is booting.
The benchmark is 22 minutes long and it consists of 128,895 read operations and 72,411 write operations. Roughly 44% of all IOs were sequential. Approximately 30% of all accesses were 4KB in size, 12% were 16KB in size, 14% were 32KB and 20% were 64KB. Average queue depth was 3.59.
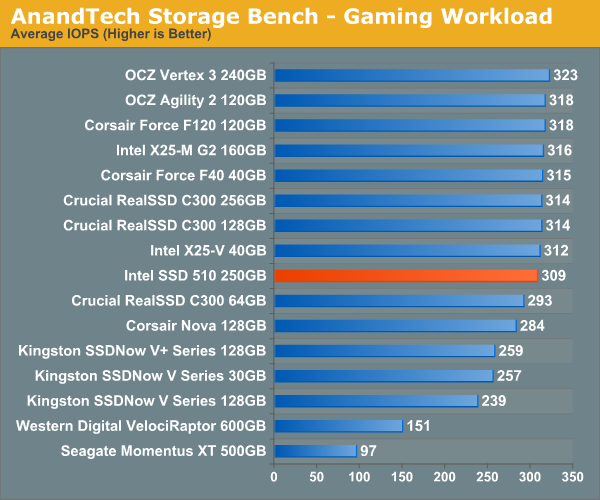
The gaming workload is made up of 75,206 read operations and only 4,592 write operations. Only 20% of the accesses are 4KB in size, nearly 40% are 64KB and 20% are 32KB. A whopping 69% of the IOs are sequential, meaning this is predominantly a sequential read benchmark. The average queue depth is 7.76 IOs.


128 Comments
View All Comments
aarste - Wednesday, March 2, 2011 - link
Those graphs on the TRIM test look nothing remotely close to ATTO, which I use. I checked HDTach as well and it wasn't that, but close.What app was it?
mino - Wednesday, March 2, 2011 - link
Please, be so king and include a fast HDD (say a WD Velociraptor) in EVERY SSD benchmark.While most readers here understand the difference between SSD and HDD, including a single fast HDD would make the article useful also as a reference/datapoint when talking to not-so-techy people.
strikeback03 - Thursday, March 3, 2011 - link
Then people would complain because the numbers are so small as to be unreadablenerex - Wednesday, March 2, 2011 - link
Maybe I missed it, but i didn't see any discussion of the power usage of the new drives- according the intel press releases, the new drives use 380mW/100mW active/idle and the G2 drives only use 150mW/75mW active/idle.This means the new drives would actually be worse on laptop battery life, correct?
DigitlDrug - Saturday, March 5, 2011 - link
Hi Anand,+1
Power consumption figures would be great for us laptop users!
I find it interesting that a number of these drives report consumption of up to 3watts and others are in the mw range when browsing the Egg.
Some clarity on power consumption would be a great addition.
As always, great review!
ClagMaster - Wednesday, March 2, 2011 - link
The Intel SSD 510 is not a bad drive but it cost more than a Vertex 2 or 3.The Intel Toolbox, and extensive compatablity and reliability testing are major pluses.
The SSD is still an extravagance for desktops though I can see its a no-brainer for laptops because of power conservation. Unless the cost per gigabyte is less than $0.80/gigabyte, the performance gain does not offset the mechanical harddrive.
neotiger - Wednesday, March 2, 2011 - link
I.e., an epic FAIL product priced at a premium to competing products that are far superior.What misguided priorities from Intel. People shell out the big bucks for SSD's for their RANDOM IO performance, NOT sequential IO. So the geniuses at Intel decided to release a "next gen" product that actually has WORSE performance than the last gen product. Really?
I'm speechless. The really sad part about this fiasco is that most people will still buy this piece of crap over far superior competing products just because it's Intel.
Just like NetBurst all over again.
strikeback03 - Thursday, March 3, 2011 - link
Did you actually look at the real-world results? the 510 is almost twice as fast as the G2 160GB in some tests.poohbear - Wednesday, March 2, 2011 - link
nice review, but you're talking & comparing the Vertex 3 and this new drive, but where's the vertex 3 on the market? its not even released, its months away from release if im not mistaken? the C400 will be released before it, so what's the point of comparing tech today with tech months away from release (and in the SSD world months is a very long time!)sor - Wednesday, March 2, 2011 - link
FWIW, we've deployed literally hundreds of X25-E drives, and our failure rate is well over 1%, closer to 2%. Usually they drop link, try to renegotiate at 1.5Gbps, and fail, so it's more likely the controller than a wear-out issue.