ASRock's High-End Vision 3D HTPC Reviewed
by Ganesh T S on October 3, 2010 10:20 AM EST
The Vision 3D is basically a notebook solution at its core. It wouldn't make sense to compare it with full blown Clarkdale HTPCs (or for that matter, any system with a power consumption of more than 100W). In the comparative benchmarks provided in the rest of this review, we will provide the scores obtained by the Vision 3D and other notebook solutions. Prior to those, let us look at some of the specific features of the Vision 3D.
USB 3.0 Performance
In the Core 100 review, we had pointed out the fact that the H55M chipset does not provide support for full USB 3.0 performance without a PLX bridge chip. As the Vision 3D caters to the high end market, it would have made sense for ASRock to incorporate this into the motherboard. Unfortunately, they decided to increase the number of USB 3.0 ports instead of aiming to obtain full performance from the pair of ports provided by the NEC controller.
We hooked up OCZ's Enyo 128 GB USB 3.0 external SSD (which has received glowing reviews everywhere with upto 200 MBps read and 190 MBps write speeds) to the various USB 2.0 / 3.0 ports of the Vision 3D (and also repeated the tests with the Core 100).
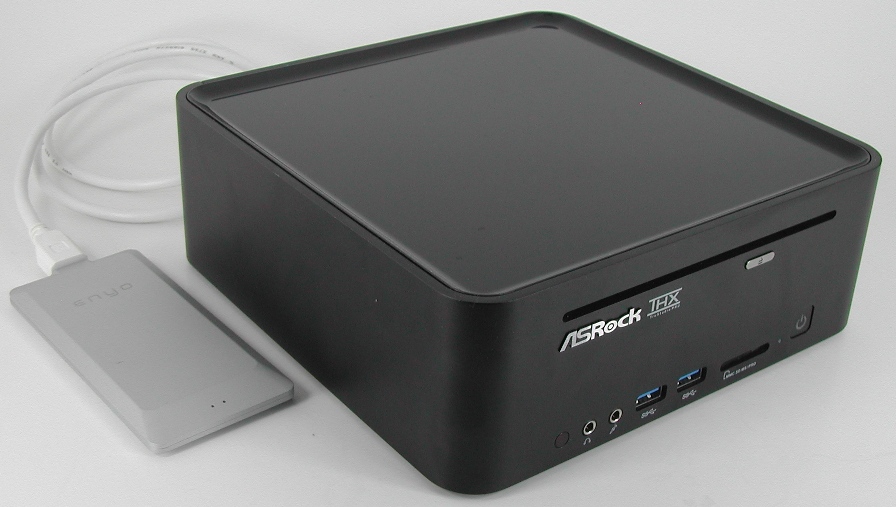
The OCZ Enyo on the Fresco Logic USB 3.0 Port of the Vision 3D
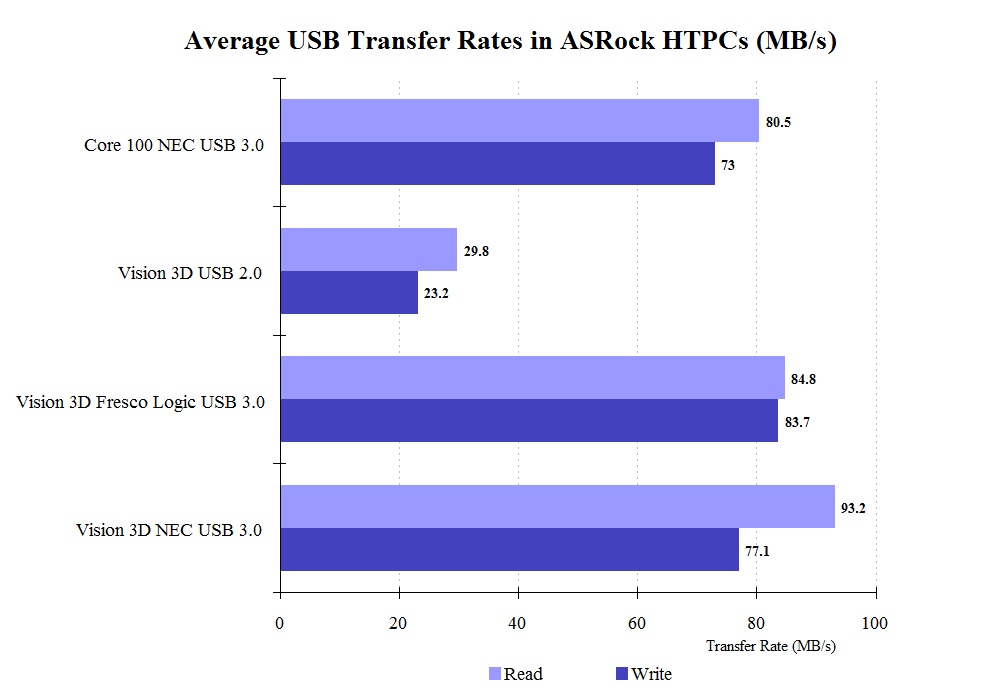
Using the Random Access feature of HD Tune Pro 4.50, we obtained the average read and write speeds for random sized accesses to random locations on the SSD. The performance metrics are graphed below. Note that the entries against the USB 3.0 ports of the Core 100 differ from those in the Core 100 review, because those were maximum transfer rates as opposed to the average rate presented here.
Click to enlarge
At the outset, it is clear that the USB 3.0 performance improves when compared with the Core 100. This is probably due to the faster i3-370M CPU. An additional interesting observation is that the read and write performance are very similar for the Fresco Logic port. The NEC ports excel at providing read bandwidth, but lose out to Fresco Logic on the write side. Despite these performance numbers, we feel that the third USB 3.0 port is an overkill for the Vision 3D. ASRock could have used the cost premium of this feature towards something more attractive for HTPC users like a SSD boot drive for the OS.
Windows Experience Index
The Core 100's Windows Experience Index was bottlenecked by the Arrandale iGPU. With that going out of the picture, what can hold back the performance of the Vision 3D? Let us look at the Windows Experience Index to get a general feel of the performance that a user can expect out of the machine.
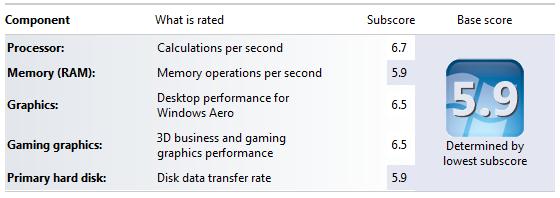
The primary hard disk and the DRAM seem to be slowing down the system. While the DRAM can be overclocked, nothing can probably be done with the primary hard disk (short of replacing it with a SSD). Unfortunately, the Scorpio Black is the fastest 500 GB 2.5" drive in the market right now, and ASRock could probably have not chosen a better drive.
Miscellaneous Performance Metrics
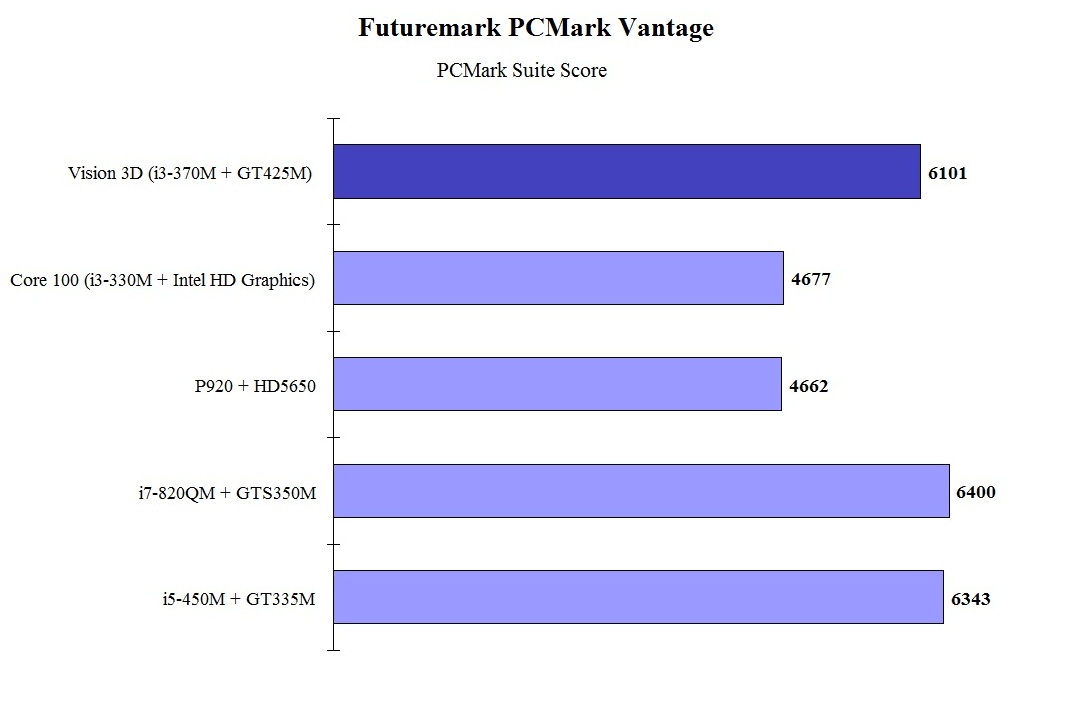
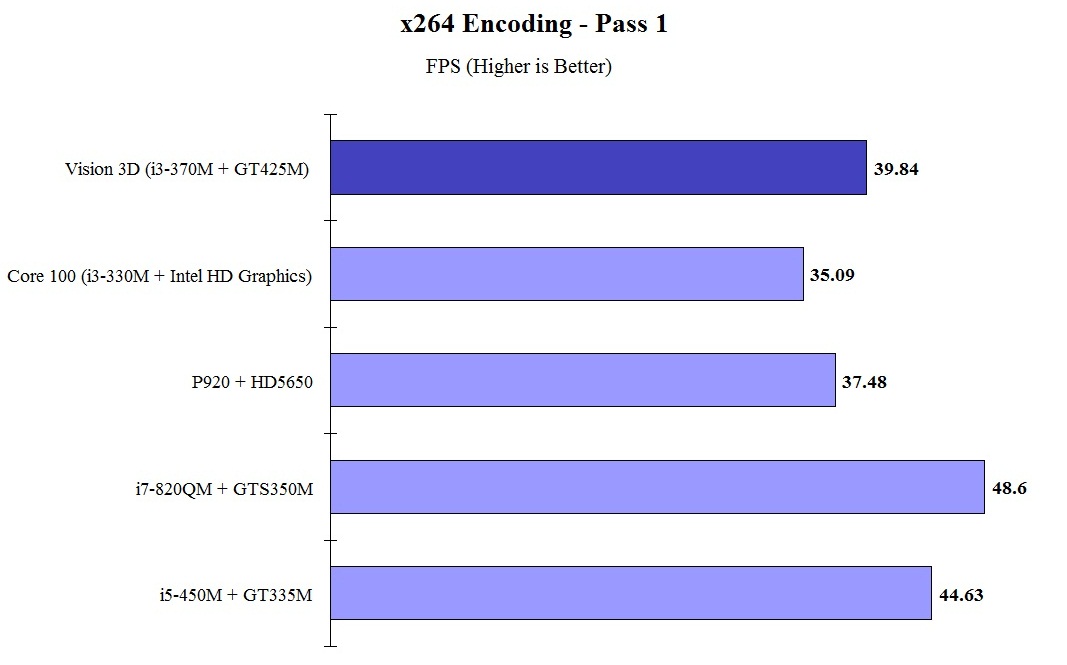
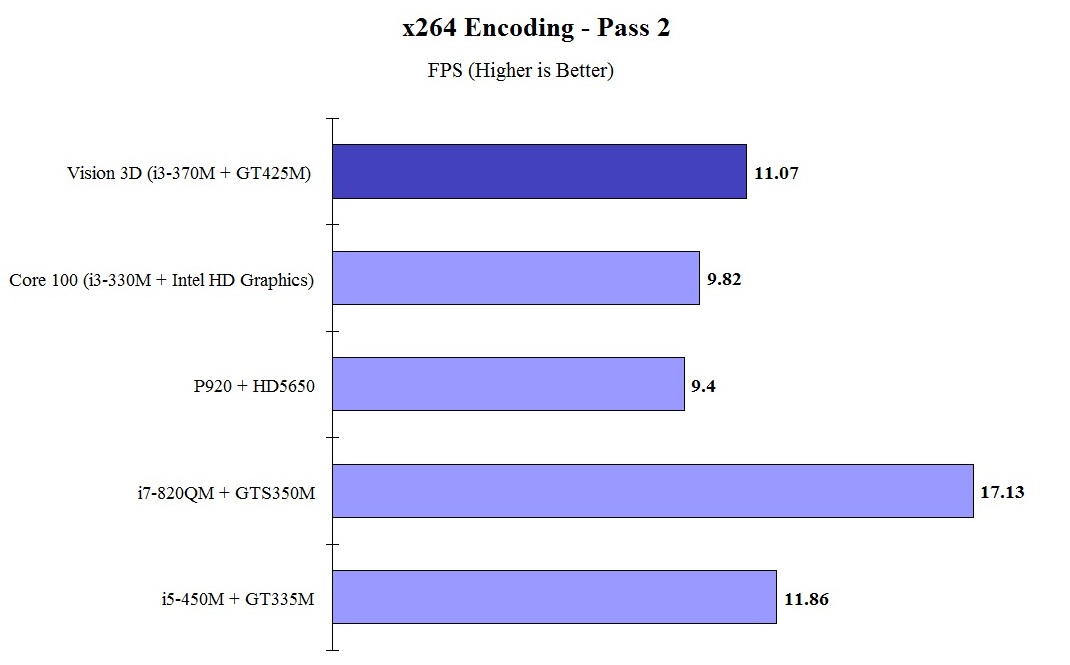
The graphs below give an idea of where the Vision 3D would stand from a performance perspective when compared with some popular notebook computers. PCMark Vantage's PCMark score gives a general idea of the system's capability. In addition to that, a couple of common HTPC workloads are also benchmarked. We have some data on the x264 encoding performance using the Arrandale CPU. An estimate of how well WinRAR performs, particularly with respect to processing split archives, wraps up this section. Since these are CPU-centric benchmarks, it comes as no surprise that the Vision 3D scores better than the
Click to enlarge
Click to enlarge
Click to enlarge
It can be seen from the above benchmarks that the Vision 3D loses out only to its higher clocked and higher core count cousins with respect to CPU-centric benchmarks. There is no doubt, however, that it provides better performance than the mid-range Core 100.
Starting with this review, we will add a WinRAR benchmark for HTPCs. While there is a built-in benchmark to measure the compression speed, it relies on the capabilities of the CPU, DRAM and caches only. Many HTPC users also spend quite some time decompressing split archives. To evaluate this, we take a 4.36 GB MKV file, compress it in the 'Best' compression mode into a split archive (97.1 MB each), which results in 44 files on the hard disk. The time taken to decompress this split archive is then recorded. The performance in this benchmark is heavily influenced by the hard disk in the system. While both the Core 100 and Vision 3D scored similar results in the built-in benchmark (1525 KBps for the Vision 3D and 1452 KBps for the Core 100), the former took 329 seconds to process the split archive, while the latter only took 173 seconds for the same. Starting with the next HTPC review, we will be presenting comparative results for this benchmark in the form of a graph.
In the next couple of sections, we will look at some GPU benchmarks.


51 Comments
View All Comments
jacksuper - Wednesday, September 14, 2011 - link
The machine looks beautiful and performs great. However, it died within a week of it's use. It would not power on! The power adapter was ok - something must have happened to the power supply. I was quite disappointed though. Had to return back to amazon.com for a refund.