Image Quality Settings and Performance
While we're inclined to say that AC only requires a "midrange" graphics card these days -- both the 8800 GT and HD 3870 can be purchased for under $200 -- there are still plenty of people out there that don't have sufficiently fast hardware to run this game at maximum settings. Lacking appropriate hardware to test a variety of other graphics cards, I instead opted to look at how the graphics settings affect performance and image quality. Below you will find image galleries showing the various settings tested as well as how those settings affect the image quality.


Subjectively, we can state of few things. First, at the lowest detail setting AC looks pretty awful. This is not a knock against the game, but it's important to remember that on low-end hardware it's essentially impossible to perform all of the high-end graphics effects. Without basic shadows and lighting, AC looks like something that would have been state-of-the-art about six or seven years ago. (The same could be said of most modern games.)
Bumping up the graphics detail to "low" enables basic (static) lighting effects, and AC looks substantially better. We still wouldn't recommend playing this way if you can avoid it, but at least it's no longer an eyesore. Note also that you can enable a high level of detail with only a moderate performance hit, which would improve the overall image quality slightly. (See below for more details.)
At our "medium" settings, the game finally starts to look like a modern title. It's likely that owners of graphics cards like the GeForce 8600 series and HD 2600 series will be best off running at medium settings, and they should be able to achieve reasonable performance at 1280x1024 (1280x720 with black bars on the top and bottom).
Finally, at maximum detail the shadow range is extended, texture quality is improved, and you get a very attractive rendition of 12th century humanity. Performance drops by roughly 20% compared to "medium" settings, and as already discussed enabling anti-aliasing will further reduce performance.
At all graphics detail settings above one, you can also choose to enable or disable "Post FX". The major area this affects is the presence or lack of motion blur when you're moving at a high rate of speed -- i.e. diving from a high point into a pile of hay or galloping on a horse. Disabling this did not appear to have a major impact on performance.
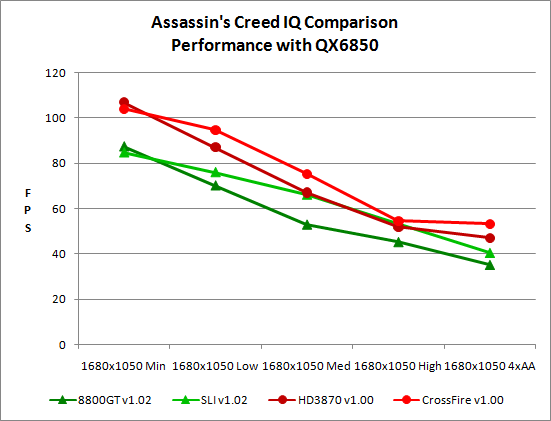
While reducing detail settings will improve performance to a certain degree, it's also important to note that CPU and overall system performance remain factors. We did some initial benchmarking with our quad-core QX6850 (really an overclocked Q6600) to see what sort of performance we were looking at. That's no slouch of a processor, and yet maximum performance even at minimum detail settings appears to top out at just over 100 FPS. Obviously, lower-end systems would not perform as well, so make sure you have sufficient CPU horsepower. The CPU-limited nature of the game is also apparent by looking at the single versus dual-GPU scores; with a 3.0GHz Core 2 processor at 1680x1050, the largest performance improvement from a second GPU is only 25%: SLI at "Medium" settings; CrossFire tops out at only a 13% performance boost.
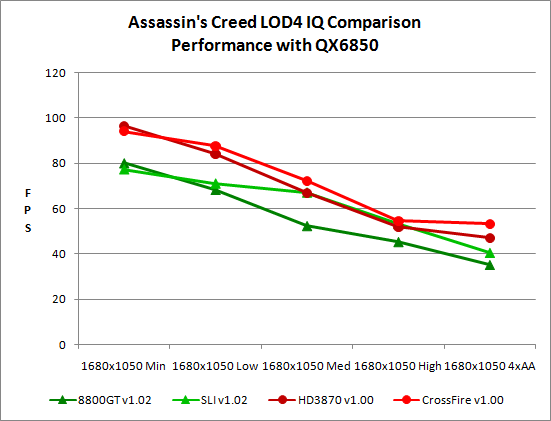
When we perform the same test as above but leave the LOD at four (the maximum setting), it's no surprise that performance drops as we become more CPU bound. (Level of Detail influences the draw distance and amount of detail seen on distant object, among other things.) Other than that, there's little difference in performance scaling. Due to the CPU-limited nature, we again see lower settings running faster with a single GPU than SLI/CrossFire.


32 Comments
View All Comments
bill3 - Monday, June 2, 2008 - link
Actually it's terrible, I cant read the graphs AT ALL.seriously my eyes just glazed over those terrible charts..completely unreadable. I still, have no idea what I'm looking at. Is ATI supposed to be faster in this game? Why did they test with version 1.00 on ATI and 1.2 on Nvidia? I dont know because the graphs are totally useless.
Nihility - Monday, June 2, 2008 - link
I second that. The graphs are terrible. Maybe bar graphs would have been better?Sometimes when you're the one making the graph it's hard to imagine what other people are seeing when they look at them. I suggest having another pair of eyes check the graphs out for readability.
Besides that, I loved the review. Especially the performance part and the 10.1 controversy.
JarredWalton - Tuesday, June 3, 2008 - link
Charts are colored with similar colors used either for ATI vs. NVIDIA, 1.00 vs. 1.02, or dual-GPU vs. single-GPU. I could have generated four times as many graphs to show the same data, but I figure most people are capable of reading the labels on a chart and figuring out what they mean. Here's a hint: when you can't see the difference between two lines because they overlap, it's a tie.If you want to give specific examples and recommendations on what would look better and still convey the same amount of information, I'm all ears. However, simply stating that "the graphs are terrible" does little to help. Tell me what graph specifically is terrible, and tell me why it's terrible.
As an example of why I used these graphs, page 9 has two charts showing 40 total data points. You can get a clear idea of how performance scales with single or dual GPUs at the various detail settings looking at a single chart. Green is NVIDIA, Red is ATI. That makes a lot of sense to me. Creating ten different bar charts with four lines in each to show the same data makes it more difficult to compare how Medium graphics compares to High graphics performance, and it takes up five times as much space to tell the same "story".
Page 6 is the same thing, but with green used for dual-GPUs (light and dark for 1.00 and 1.02) and red for single GPUs. 24 data points in two charts instead of using six charts. Having established that 1.00 doesn't perform any different than 1.02 on NVIDIA hardware, I skipped the 1.00 NVIDIA numbers to make those charts easier to read on page 7. Then I put in the four standard test system (0xAA and 4xAA, ATI and NVIDIA) on 1.02, with 1.00 4xAA ATI in blue as a reference.
Lastly, on page 8 I have two clock speeds on NVIDIA, three on ATI, with different base colors for single and dual GPUs. ATI and NVIDIA are in separate charts, and brighter colors are for a higher overclock.
There's method to my graphing madness. Are the charts immediately clear to a casual glance? No, but then that's really difficult to do while still conveying all of the information. I spent a lot of time trying to make comprehensible charts, and settled on these as the best option I could come up with. Again, if they're so bad, it must be easy to generate something clearly better - have at it, and I'll be happy to use any sensible suggestions. However, if the only complaint is that you actually have to look at the charts and think for a minute before you understand, I'm not likely to be very sympathetic. I think our readers are smart enough to digest these graphs.
mpjesse - Monday, June 2, 2008 - link
While I appreciate the detailed review, isn't it a little irrelevant now? I mean, the game's been out for nearly 2 months now and it's been reviewed everywhere. The only thing new about this review are the performance benchmarks, in which case I would have have made the review solely about performance instead of gameplay.Just my 2 cents.
ImmortalZ - Monday, June 2, 2008 - link
Its sad that the companies with money always manage to suppress innovation.I hope this article by AT will raise some ruckus in the collective Interwebs and cause something. But I doubt it.
ViRGE - Monday, June 2, 2008 - link
For what it's worth, another forum I read had some screenshots comparing DX10 and DX10.1. The problems the poster had managed to find involved trees; there was some kind of post-processing rendering going on with trees that wasn't occurring with DX10.1, which made them look weird.Not fixing 10.1 may be an NVIDIA thing, but there was definitely a problem with it as-is.
tuteja1986 - Monday, June 2, 2008 - link
Well why where the hell is nvidia dx10.1 support if dx10.1 actually brings some kind of performance improvement in AA.Why aren't GT200 series have DX10.1 ?
I thought PC gaming was all about being the cutting edge on all technology front...
Anyways , this is not the 1st time Ubisoft or Nvidia have done this.
wyemarn - Monday, June 2, 2008 - link
Maybe because Nvidia GPUs cant support AA through shaders. So no use supporting dx 10.1. ATI GPUs have 320 stream processors so it can utilize for shaders and etc. Nvidia cards have less SPs but more ROPs, TMUs which translates to more brute power if games dont use shaders or SPs much. Technology wise, I think ATI is ahead but NVIDIA GPUs have game developer support and more raw horsepower so performance wise NVIDIA is ahead and I think this trend will continue with GTX200 series. I choosed G92 over RV670 because the raw performance is much better even though on paper HD 3800 series look great.SteelSix - Monday, June 2, 2008 - link
Worthy of a thread in Video. I just started one..Gannon - Monday, June 2, 2008 - link
The original halo had performance issues but they weren't alarming, halo was actually not too bad port compared to many other console to PC disasters. Halo 1 got 'better with hardware' advancing. Halo 2 on the other hand is just all around atrocious. Halo 2 was just not a very well made game, period, despite the addition of cutscenes, etc. Halo 1 had a much better feel and better vehicle design IMHO, I hated how the warthog looked in Halo 2, it annoyed me to no end.