Investigations into Socket 939 Athlon 64 Overclocking
by Jarred Walton on October 3, 2005 4:35 PM EST- Posted in
- CPUs
Power Supply
Despite what manufacturers might want you to believe, power supplies are less about wattage and more about the amount and quality of current that they can supply. In theory, the Watts rating of a PSU can be determined with the current and voltage ratings. Using the equation P = I x V (Power = Current x Voltage), you can come up with a Wattage for each voltage that the PSU provides, add them all together, and you have the rating. Simple enough, right? Unfortunately, there are problems with this method of rating a power supply.
The biggest problem is that PCs don't require equal amounts of power from each voltage, and the wattage rating simply serves to obfuscate the real power levels. The +12V rating is generally the most important rating, and modern ATX2.0 PSUs actually require two +12V rails (i.e. outputs form the PSU). Two 500W PSUs from different manufacturers could actually have wildly different characteristics in the type of power that they provide. In a really bad PSU, reality can be further distorted by providing high output ratings on the -5V and -12V lines. Computers draw very little power from the negative lines, so if a PSU were to rate the -12V line at 3A instead of a more common 1A (or less), they can inflate their wattage by 25W or more. As if that isn't bad enough, there are even more ways to "cheat" the rating.
Temperature plays a role in determining the output capacity of a power supply. You can read about it elsewhere, but the main concept is the following: "The thermal capacity of materials changes slightly with temperature primarily due to changes in density." Part of what allows a power supply to provide current at a specific voltage is the ability to transform the 115V input from the wall (or 230V in other areas of the world) to a different value. Such a change creates heat, and the heat has to be dissipated. Inside a power supply, you will find heat sinks much like what you see on a motherboard, along with a cooling fan or fans. Depending on how the power supply is rated, it might actually provide 450W at 10 degrees C and only 375 W at 30 degrees C. (You'd have to know the specific heat values for the various materials inside a PSU to really be able to calculate how temperature affects the output capacity for a specific PSU.) Nearly all modern computers will have a case temperature in the 30 degrees C or higher range, so a PSU rated using 10-25 degrees C values is far from a realistic representation of the PSU's output capacity.
Lastly, just because a power supply can provide a specific output doesn't mean it can do so well. In the US, power from the wall outlets comes at 115V, but variance is allowed. In fact, the output voltage can fluctuate between 110V and 121V (5%) while still being within spec. That may be fine for some household items like lamps and coffee makers, but computers tend to be a little more demanding in their requirements. A power supply that outputs 3.2V, 4.8V, and 11.5V is still technically within the required range, and there's a good chance that it will work with a typical PC. What really causes problems are fluctuations, which are usually influenced by the use of lower quality components as well as temperature changes. Even though a PSU might work in a regular PC, though, overclocking really pushes things to the limit, and it's far better to have a PSU that can output voltages exactly at spec than a few percent high or low.
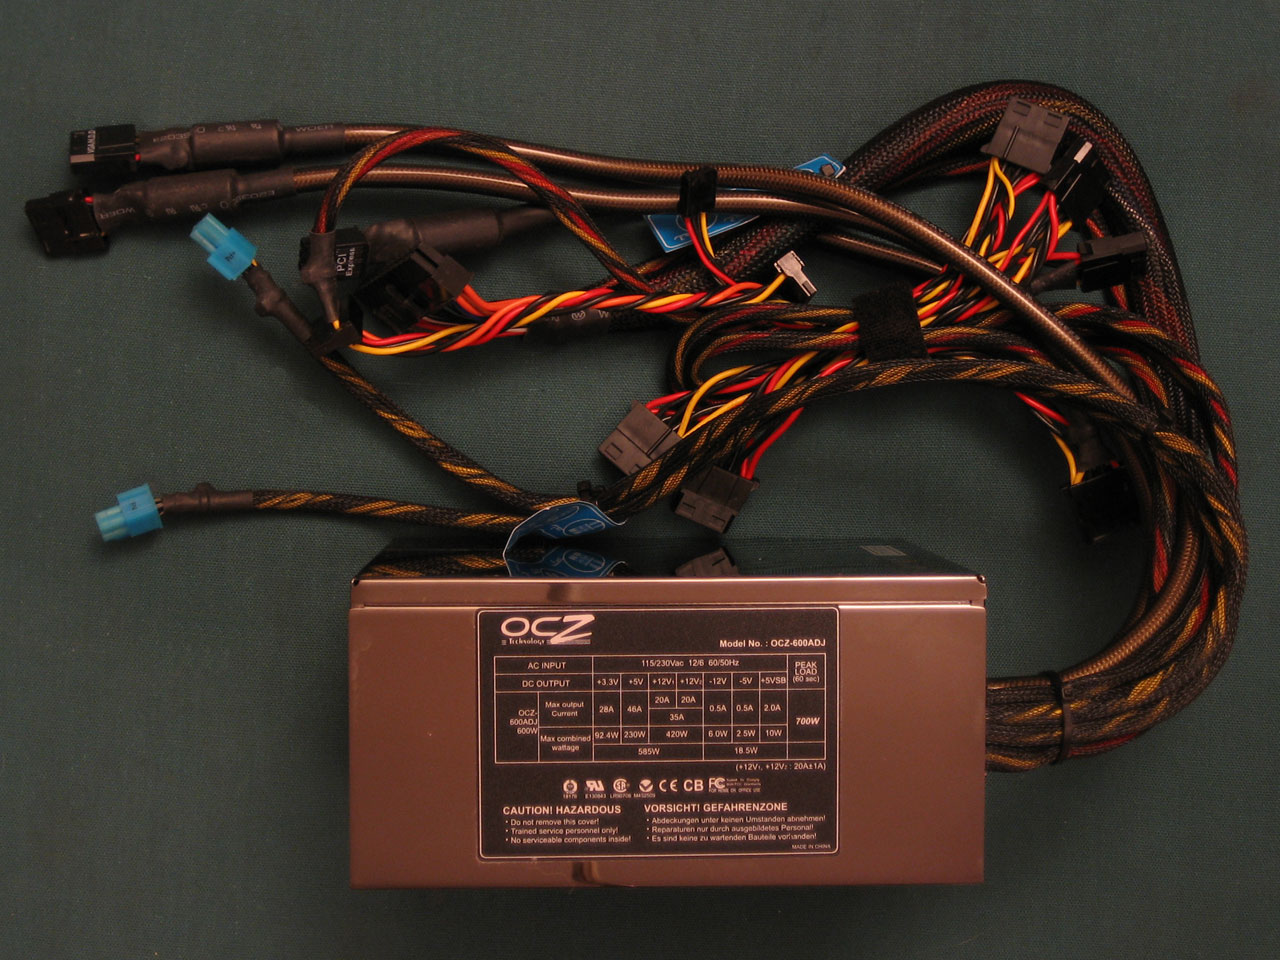
One of the easiest ways to determine the quality of a power supply is to simply pick it up. A 500W power supply should weigh quite a bit more than a 350W power supply; if it doesn't, be suspicious. Reading the label on a power supply can be helpful, but that doesn't usually tell you the temperature at which it was tested, and of course, it could always be inaccurate. The saying "you get what you pay for" also applies, so if a PSU costs far less than the rating would suggest, it's likely that the unit isn't really as good as the sticker claims. A better idea is to just go with a respected name, as we suggested with motherboards. Our top picks for PSU manufacturers are Antec, Enermax, Fotron Source, OCZ, and Seasonic. Enermax, OCZ and Seasonic are probably the safest bets, as they don't really have "value" and "performance" parts right now, though the more expensive Antec and Fotron Source units are just as good. If you want a high quality power supply and you're shopping online, here's the fastest test: does it cost less than $75? If so, it's probably a moderate unit, and under $50 is an inexpensive unit. The good power supplies almost always cost $80 or more. If you're not sure, though, ask around! Some times, there are good deals to be had on high quality power supplies.
With all the above talk about getting a quality power supply, we also ran some tests using a cheap PSU that came with an even cheaper case. The case was the MGE and 400W PSU that we recommended in our last Budget Buyer's Guide. The case is flimsy, made of thin aluminum, and the cables for the front USB and Firewire ports were very difficult to work with - they were separated into single-pin connectors rather than a block of pins. It's impossible to say what the long-term reliability of such a case is, but it's been running nearly 24/7 for a couple of months now without any problems. The highest overclocks seemed a bit less stable with the 20-pin power connection, but we did manage to match the overclock of the OCZ PowerStream 600W. Maximum power draw for the test configuration was measured at around 220W, so we never came close to the 400W power rating.
Despite what manufacturers might want you to believe, power supplies are less about wattage and more about the amount and quality of current that they can supply. In theory, the Watts rating of a PSU can be determined with the current and voltage ratings. Using the equation P = I x V (Power = Current x Voltage), you can come up with a Wattage for each voltage that the PSU provides, add them all together, and you have the rating. Simple enough, right? Unfortunately, there are problems with this method of rating a power supply.
The biggest problem is that PCs don't require equal amounts of power from each voltage, and the wattage rating simply serves to obfuscate the real power levels. The +12V rating is generally the most important rating, and modern ATX2.0 PSUs actually require two +12V rails (i.e. outputs form the PSU). Two 500W PSUs from different manufacturers could actually have wildly different characteristics in the type of power that they provide. In a really bad PSU, reality can be further distorted by providing high output ratings on the -5V and -12V lines. Computers draw very little power from the negative lines, so if a PSU were to rate the -12V line at 3A instead of a more common 1A (or less), they can inflate their wattage by 25W or more. As if that isn't bad enough, there are even more ways to "cheat" the rating.
Temperature plays a role in determining the output capacity of a power supply. You can read about it elsewhere, but the main concept is the following: "The thermal capacity of materials changes slightly with temperature primarily due to changes in density." Part of what allows a power supply to provide current at a specific voltage is the ability to transform the 115V input from the wall (or 230V in other areas of the world) to a different value. Such a change creates heat, and the heat has to be dissipated. Inside a power supply, you will find heat sinks much like what you see on a motherboard, along with a cooling fan or fans. Depending on how the power supply is rated, it might actually provide 450W at 10 degrees C and only 375 W at 30 degrees C. (You'd have to know the specific heat values for the various materials inside a PSU to really be able to calculate how temperature affects the output capacity for a specific PSU.) Nearly all modern computers will have a case temperature in the 30 degrees C or higher range, so a PSU rated using 10-25 degrees C values is far from a realistic representation of the PSU's output capacity.
Lastly, just because a power supply can provide a specific output doesn't mean it can do so well. In the US, power from the wall outlets comes at 115V, but variance is allowed. In fact, the output voltage can fluctuate between 110V and 121V (5%) while still being within spec. That may be fine for some household items like lamps and coffee makers, but computers tend to be a little more demanding in their requirements. A power supply that outputs 3.2V, 4.8V, and 11.5V is still technically within the required range, and there's a good chance that it will work with a typical PC. What really causes problems are fluctuations, which are usually influenced by the use of lower quality components as well as temperature changes. Even though a PSU might work in a regular PC, though, overclocking really pushes things to the limit, and it's far better to have a PSU that can output voltages exactly at spec than a few percent high or low.
One of the easiest ways to determine the quality of a power supply is to simply pick it up. A 500W power supply should weigh quite a bit more than a 350W power supply; if it doesn't, be suspicious. Reading the label on a power supply can be helpful, but that doesn't usually tell you the temperature at which it was tested, and of course, it could always be inaccurate. The saying "you get what you pay for" also applies, so if a PSU costs far less than the rating would suggest, it's likely that the unit isn't really as good as the sticker claims. A better idea is to just go with a respected name, as we suggested with motherboards. Our top picks for PSU manufacturers are Antec, Enermax, Fotron Source, OCZ, and Seasonic. Enermax, OCZ and Seasonic are probably the safest bets, as they don't really have "value" and "performance" parts right now, though the more expensive Antec and Fotron Source units are just as good. If you want a high quality power supply and you're shopping online, here's the fastest test: does it cost less than $75? If so, it's probably a moderate unit, and under $50 is an inexpensive unit. The good power supplies almost always cost $80 or more. If you're not sure, though, ask around! Some times, there are good deals to be had on high quality power supplies.
Click to enlarge.
With all the above talk about getting a quality power supply, we also ran some tests using a cheap PSU that came with an even cheaper case. The case was the MGE and 400W PSU that we recommended in our last Budget Buyer's Guide. The case is flimsy, made of thin aluminum, and the cables for the front USB and Firewire ports were very difficult to work with - they were separated into single-pin connectors rather than a block of pins. It's impossible to say what the long-term reliability of such a case is, but it's been running nearly 24/7 for a couple of months now without any problems. The highest overclocks seemed a bit less stable with the 20-pin power connection, but we did manage to match the overclock of the OCZ PowerStream 600W. Maximum power draw for the test configuration was measured at around 220W, so we never came close to the 400W power rating.


101 Comments
View All Comments
intellon - Tuesday, October 4, 2005 - link
I understand how/why the memory quality is not too imoprtant (5-9% increase for 100 bucks = not worthy)What I AM unclear about is the cpu itself. Would all the cpu's based on venice hit a same ceiling. Or would a 3800+ reach a higher, more stable, cooler overclock than the 3200+? There is one line that mentions these two cpu's on the first page but no comment on how they would perform when overclocked. Does a 12x help over 9x? Also am I wrong in assuming that you picked 3200+ over 3000+ because of a higher multiplier?
And like people are asking... how bad/good are the other chips? How'll a San Diego 3500+ fare against a Venice 3500+? They're faster as stock, but can they match or exceed overclock performance of venice?
Questions questions questions...
The article was wicked though. I was skeptical about buying a cheaper RAM... but seeing how another $50 is not going to help, I'll save that money for something else.
gplracer - Tuesday, October 4, 2005 - link
Very nice article. It appears to be well thought out. Thanks for the time you spent on it. I would also be nice to have an article of this type with some of the more popular power supplies.I to have had several chips that would overclock such as:
P166 @ 200mhz lol
Celeron 300a @ 450mhz
Duron 600 @ 950mhz
Athlon 1700+ (DLTC3) @ 2374mhz
2600+ at 250x10= 2500mhz
There is no way you could add all of the cpus to the review. I look forward to overclocking a dual core athlon64.
PaBlooD - Tuesday, October 4, 2005 - link
Great Articule.. thanks for that great work.I actually have a A64 3200+ Winchester core with an Epox 9NDA3+ + 512 x2 ocz premier (crap ) and i only can get the procesor to 2150 mhz... i tried with safe memo times.. but nothing..are that bad overclockers the Winchester cores? :S
(excuse my poor english ^_^)
RaulAssis - Wednesday, December 21, 2005 - link
Didi you try memory deviders like 5/6 ?yacoub - Tuesday, October 4, 2005 - link
I definitely appreciate all the walk-through of overclocking an A64 system. Very good article. One thing though - the last few pages with the test result charts... the charts make it look like the entire notion of overclocking is rather pointless since all four colored lines are nearly identical in all but a couple tests. You might want to consider a different type of chart next time that gives a -visual- impression of the benefit to better support the written descriptive increases in performance. Maybe some sort of bar chart would have worked better.JarredWalton - Tuesday, October 4, 2005 - link
I felt the visual impression conveyed exactly what I saw: the difference between the 3000+ and 3200+ in overclocking combined with value and performance RAM is, at best, small. I understand what you're saying, and trust me: I played around with the Excel graphs for many hours. None of the graphs really gave a clear picture, unfortunately. Getting four setups with about 9 settings each into a single chart is messy. Having 80 charts is even worse. Heheh.If someone can show me a preferred chart style, I'll be happy to change the graph for the next installment. The AnandTech graphing engine really wasn't capable of dealing with this type of data set, unfortunately... but Excel was only marginally better.
intellon - Tuesday, October 4, 2005 - link
I guess you could "ZOOM IN" onto the y-axis. For instance: on the last graph HL2 1024x768 4xAA, since the minimum was above 80 and max was below 140, you could set the min and max ranges of y-axis accordingly. or go GNU plot way for a sharper graph.JarredWalton - Tuesday, October 4, 2005 - link
Like the 3DMark GPU scores? I really dislike graphs that don't start at 0, because it hides the reality. (That's why I put the extra paragraph on the 3DMark scores noting specifically that they don't start at 0.) I can blow up a graph so that everyone can see the 1 or 2% margin of victory, but what does that really say? Margin of error on several benchmarks is at least 1 or 2%, and in actual use I don't think anyone will really notice even a 5% difference - I know I don't.Some people will be annoyed by this, but too many people worry about the last 1% of performance. Not because they can notice a difference, but because they want meaningless bragging rights. Sitting in the top positions in an online game requires skill. Getting 1% higher FPS usually just involves throwing more money at your PC than the next guy. Some people like to do that - sort of like some people like muscle cars. I want a fast computer, but I'm not going to lose sleep because my PC is marginally slower than my friend's, you know?
Anyway, I may look into a separate graphing tool. Excel looks fine internally, but getting the graphs into image form didn't work perfectly. The text alignment got a little tweaked when I cut and pasted the data into Photoshop.
Regards,
Jarred Walton
RupertS - Wednesday, October 19, 2005 - link
Be careful, I think Muscle Car owners are a protected class.probedb - Tuesday, October 4, 2005 - link
I'd just like to say cheers for this. It's made me finally get round to trying to OC my system. I purposely bought a 3000+ and Crucial Ballistix for this but have never got round to trying it.I shall give it a go this weekend!!!