SATA II to the Power of 3.0Gb/sec: Three Drives Reviewed
by Purav Sanghani on June 25, 2005 7:06 PM EST- Posted in
- Storage
Overall System Performance - SYSMark 2004
SYSMark 2004 is divided into two separate suites: Internet Content Creation and Office Productivity. What makes SYSMark an ideal hard disk benchmark is that its scores are totals of response times, meaning that the benchmark measures how long the system takes to respond to a task (e.g. how long before a search and replace is completed after it is initiated) and sums up all such response times to generate a score. This score is generated for six total subcategories: three under Internet Content Creation and three under Office Productivity.
For the most part, SYSMark is CPU/platform bound, but we will see some variations in performance according to disk speed; at the same time, there are a couple of benchmarks within SYSMark that are heavily disk dependent.
Internet Content Creation Performance
Our results showed very little difference in the performance of the competitors; not enough to rule out margin of error in the Content Creation part of SYSMark 2004. The scores for the majority of drives landed between 180-183 which does not show too well which drive performs better than the rest.
Office Productivity Performance
SYSMark's Office Productivity suite consists of three tests, the first of which is the Communication test. The Communication test consists of the following:
"The user receives an email in Outlook 2002 that contains a collection of documents in a zip file. The user reviews his email and updates his calendar while VirusScan 7.0 scans the system. The corporate web site is viewed in Internet Explorer 6.0. Finally, Internet Explorer is used to look at samples of the web pages and documents created during the scenario."
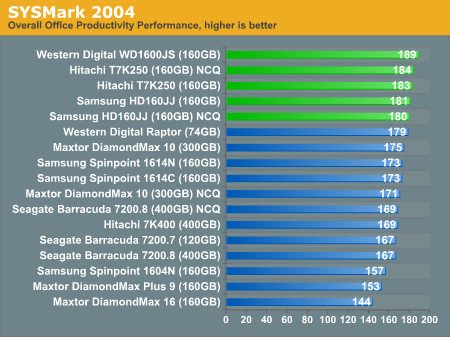
Surprisingly the SATA300 drives showed a good performance increase over the SATA150 drives as our 3 test units topped the charts with Western Digital coming in at first followed by Hitachi and Samsung.


52 Comments
View All Comments
mechBgon - Sunday, June 26, 2005 - link
Interestingly, my old Cheetah 15k.3 still spanks my Seagate 7200.8 OMGNCQSATABBQ drive by a factor of about 2:1 on seek-intensive real-world work tasks. People with seek-intensive work to do should still explore the SCSI option if it seems like their I/O is holding up the show.PuravSanghani - Sunday, June 26, 2005 - link
All graphs should be fixed now.We did use Hitachi's Feature tool to enable SATA 3.0Gb/sec mode prior to the benchmarks.
Purav
ArcticOC - Saturday, June 25, 2005 - link
Was the sata2 mode enabled og the test?! This HAVE to bee done after you buy the drive.. because the deafult speed is to 150MB/secsoftware from hitachi have to be run in order to enable 300mode
http://forum.hardware.no/index.php?act=Attach&...
Viper4185 - Saturday, June 25, 2005 - link
No graphs for me either! Something is broken!Souka - Saturday, June 25, 2005 - link
That is one ugly review.They should pull it, fix it, then repost
ArcticOC - Saturday, June 25, 2005 - link
I really hope the testers to their time setting sataII mode to the Hitachi, This ahve to be done manually by their software called "IBM feature tool", unless u do this, det disk will run at low sata 150 instead of the 300mode.http://forum.hardware.no/index.php?act=Attach&...
The disk comes by deafults w/interface of only 150.. chech taht this important is used under all test.. anything else would be BS if not
GhandiInstinct - Saturday, June 25, 2005 - link
My raptor still at reign.SocrPlyr - Saturday, June 25, 2005 - link
Graphs on some pages and not on others in IE6.Everything looks great in Firefox
Josh
RMSistight - Saturday, June 25, 2005 - link
Still no graphs for some pages! I need to read the game loading times!CrystalBay - Saturday, June 25, 2005 - link
Well looks like I'll be keeping my 120GB 7200.7 a little longer. :)