Retesting AMD Ryzen Threadripper’s Game Mode: Halving Cores for More Performance
by Ian Cutress on August 17, 2017 12:01 PM ESTCPU Legacy Tests
Our legacy tests represent benchmarks that were once at the height of their time. Some of these are industry standard synthetics, and we have data going back over 10 years. All of the data here has been rerun on Windows 10, and we plan to go back several generations of components to see how performance has evolved.
All of our benchmark results can also be found in our benchmark engine, Bench.
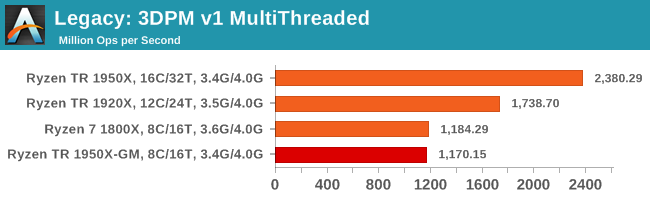
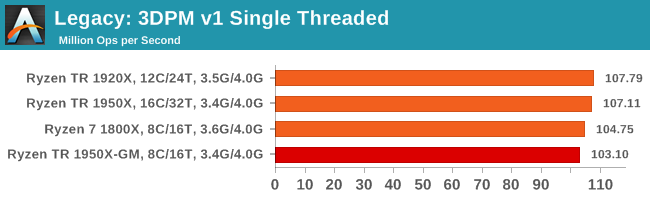
3D Particle Movement v1
3DPM is a self-penned benchmark, taking basic 3D movement algorithms used in Brownian Motion simulations and testing them for speed. High floating point performance, MHz and IPC wins in the single thread version, whereas the multithread version has to handle the threads and loves more cores. This is the original version, written in the style of a typical non-computer science student coding up an algorithm for their theoretical problem, and comes without any non-obvious optimizations not already performed by the compiler, such as false sharing.
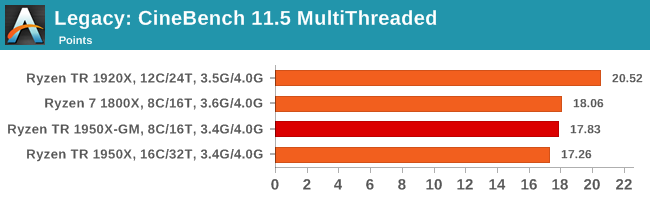
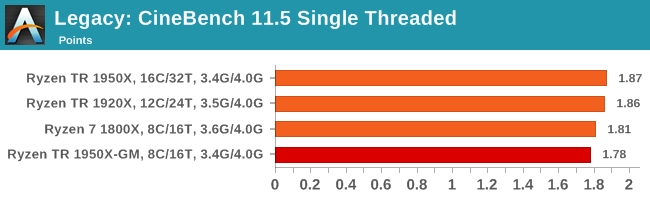
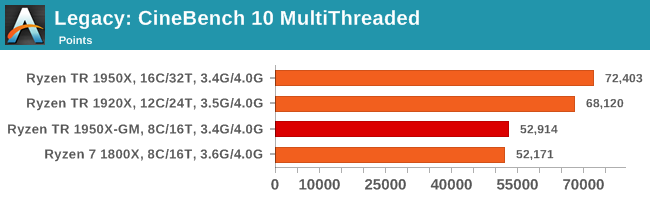
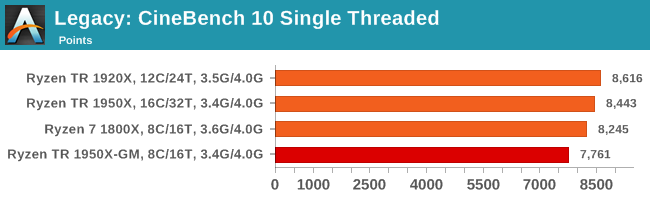
CineBench 11.5 and 10
Cinebench is a widely known benchmarking tool for measuring performance relative to MAXON's animation software Cinema 4D. Cinebench has been optimized over a decade and focuses on purely CPU horsepower, meaning if there is a discrepancy in pure throughput characteristics, Cinebench is likely to show that discrepancy. Arguably other software doesn't make use of all the tools available, so the real world relevance might purely be academic, but given our large database of data for Cinebench it seems difficult to ignore a small five minute test. We run the modern version 15 in this test, as well as the older 11.5 and 10 due to our back data.
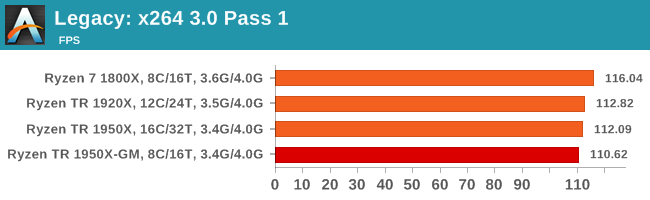
x264 HD 3.0
Similarly, the x264 HD 3.0 package we use here is also kept for historic regressional data. The latest version is 5.0.1, and encodes a 1080p video clip into a high-quality x264 file. Version 3.0 only performs the same test on a 720p file, and in most circumstances the software performance hits its limit on high-end processors, but still works well for mainstream and low-end. Also, this version only takes a few minutes, whereas the latest can take over 90 minutes to run.
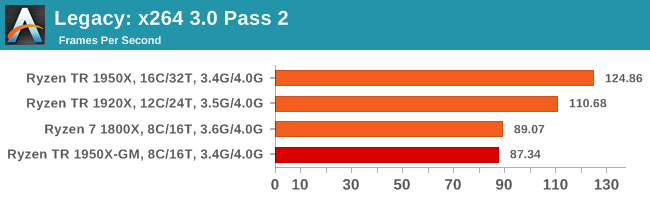
The 1950X: the first CPU to score higher on the 2nd pass of this test than it does on the first pass.


104 Comments
View All Comments
peevee - Friday, August 18, 2017 - link
Of course. Work CPUs must be tested at work. Kiddies are fine with i3s.Ian Cutress - Sunday, August 20, 2017 - link
https://myhacker.net hacking news hacking tutorials hacking ebooksIGTrading - Thursday, August 17, 2017 - link
It would be nice and very useful to post some power consumption results at the platform level, if we're doing "extra" additional testing.It is very important since we're paying for the motherboard just as much as we pay for a Ryzen 5 or even Ryzen 7 processor.
And it will correctly compare the TCO of the X399 platform with the TCO of X299.
jordanclock - Thursday, August 17, 2017 - link
So it looks like AMD should have gone with just disabling SMT for Game Mode. There are way more benefits and it is easier to understand the implications. I haven't seen similar comparisons for Intel in a while, perhaps that can be exploration for Skylake-X as well?HStewart - Thursday, August 17, 2017 - link
I would think disable SMT would be better, but the reason maybe in designed of link between the two 8 Core dies on chip.GruenSein - Thursday, August 17, 2017 - link
I'd really love to see a frame time probability distribution (Frame time on x-axis, rate of occurrence on y-axis). Especially in cases with very unlikely frames below a 60Hz rate, the difference between TR and TR-GM/1800X seem most apparent. Without the distribution, we will never know if we are seeing the same distribution but slightly shifted towards lower frame rates as the slopes of the distribution might be steep. However, those frames with frame times above a 60Hz rate might be real stutters down to a 30Hz rate but they might just as well be frames at a 59,7Hz rate. I realize why this threshold was selected but every threshold is quite arbitrary.MrSpadge - Thursday, August 17, 2017 - link
Does AMD comment on the update? What's their reason for choosing 8C/16T over 16C/16T?> One could postulate that Windows could do something similar with the equivalent of hyperthreads.
They're actually already doing that. Loading 50% of all threads on an SMT machine will result in ~50% average load on every logical core, i.e. all physical cores are only working on 1 thread at a time.
I know mathematically other schedulings are possible, leading to the same result - but by now I think it's common knowledge that the default Win scheduler works like that. Hence most lightly threaded software is indifferent to SMT. Except games.
NetMage - Sunday, August 20, 2017 - link
Then why did SMT mode show differences from Creator mode in the original review?Dribble - Thursday, August 17, 2017 - link
No one is ever going to run game mode - why buy a really expensive chip and then disable half of it, especially as you have to reboot to do it? It's only use is to make threadripper look slightly better in reviews. Imo it would be more honest as a reviewer to just run it in creator mode all the time.jordanclock - Thursday, August 17, 2017 - link
The point is compatibility, as mentioned in the article multiple times. AMD is offering this as an option for applications (mainly games) that do not run correctly, if at all, on >16 core CPUs.