The AMD Ryzen Threadripper 1950X and 1920X Review: CPUs on Steroids
by Ian Cutress on August 10, 2017 9:00 AM ESTRocket League
Hilariously simple pick-up-and-play games are great fun. I'm a massive fan of the Katamari franchise for that reason — passing start on a controller and rolling around, picking up things to get bigger, is extremely simple. Until we get a PC version of Katamari that I can benchmark, we'll focus on Rocket League.
Rocket League combines the elements of pick-up-and-play, allowing users to jump into a game with other people (or bots) to play football with cars with zero rules. The title is built on Unreal Engine 3, which is somewhat old at this point, but it allows users to run the game on super-low-end systems while still taxing the big ones. Since the release in 2015, it has sold over 5 million copies and seems to be a fixture at LANs and game shows. Users who train get very serious, playing in teams and leagues with very few settings to configure, and everyone is on the same level. Rocket League is quickly becoming one of the favored titles for e-sports tournaments, especially when e-sports contests can be viewed directly from the game interface.

Based on these factors, plus the fact that it is an extremely fun title to load and play, we set out to find the best way to benchmark it. Unfortunately for the most part automatic benchmark modes for games are few and far between. Partly because of this, but also on the basis that it is built on the Unreal 3 engine, Rocket League does not have a benchmark mode. In this case, we have to develop a consistent run and record the frame rate.
Read our initial analysis on our Rocket League benchmark on low-end graphics here.
With Rocket League, there is no benchmark mode, so we have to perform a series of automated actions, similar to a racing game having a fixed number of laps. We take the following approach: Using Fraps to record the time taken to show each frame (and the overall frame rates), we use an automation tool to set up a consistent 4v4 bot match on easy, with the system applying a series of inputs throughout the run, such as switching camera angles and driving around.
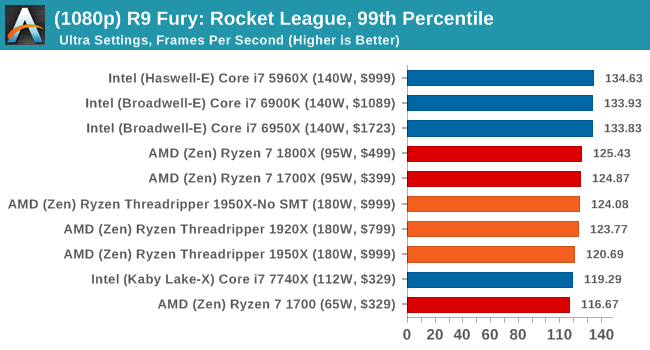
It turns out that this method is nicely indicative of a real bot match, driving up walls, boosting and even putting in the odd assist, save and/or goal, as weird as that sounds for an automated set of commands. To maintain consistency, the commands we apply are not random but time-fixed, and we also keep the map the same (Aquadome, known to be a tough map for GPUs due to water/transparency) and the car customization constant. We start recording just after a match starts, and record for 4 minutes of game time (think 5 laps of a DIRT: Rally benchmark), with average frame rates, 99th percentile and frame times all provided.
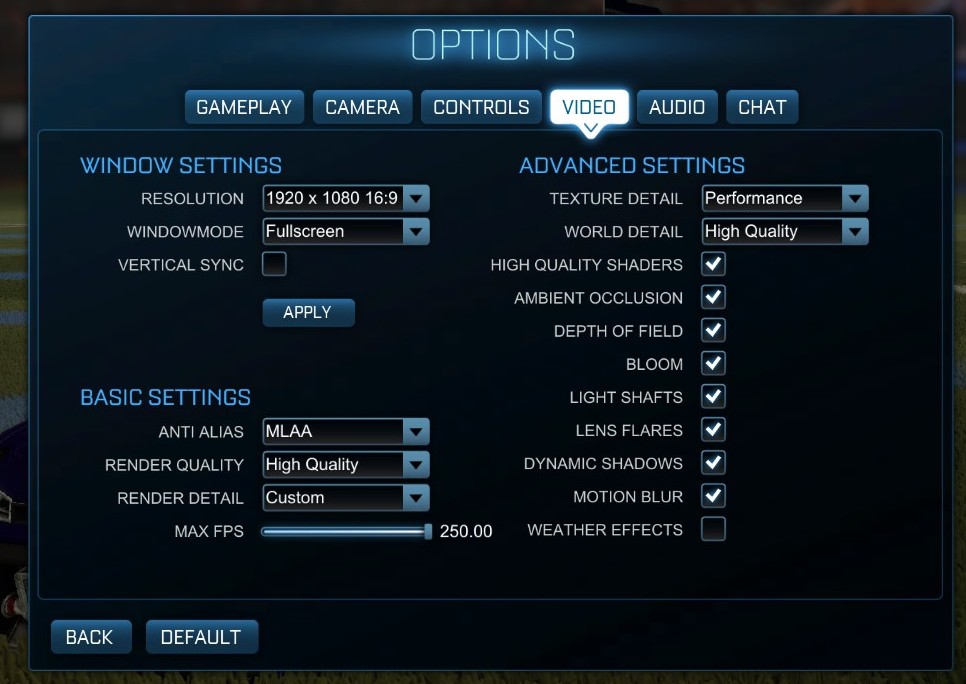
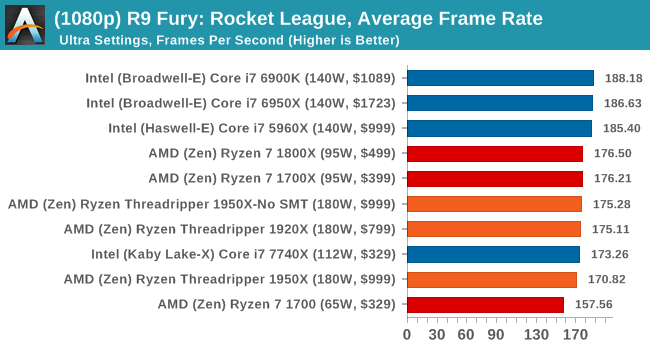
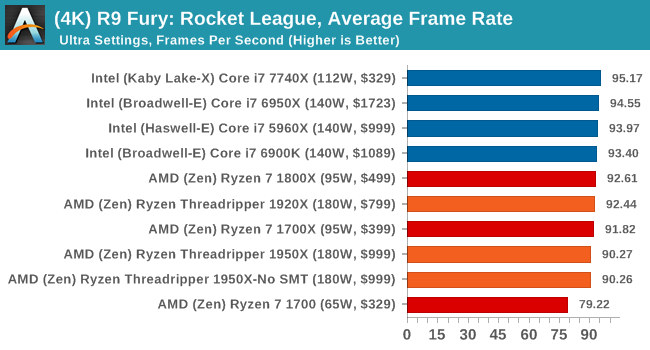
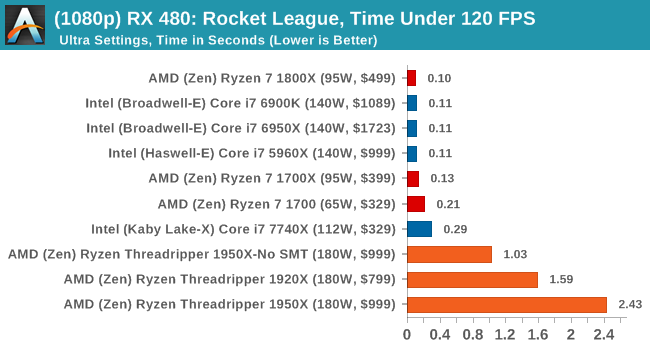
The graphics settings for Rocket League come in four broad, generic settings: Low, Medium, High and High FXAA. There are advanced settings in place for shadows and details; however, for these tests, we keep to the generic settings. For both 1920x1080 and 4K resolutions, we test at the High preset with an unlimited frame cap.
All of our benchmark results can also be found in our benchmark engine, Bench.
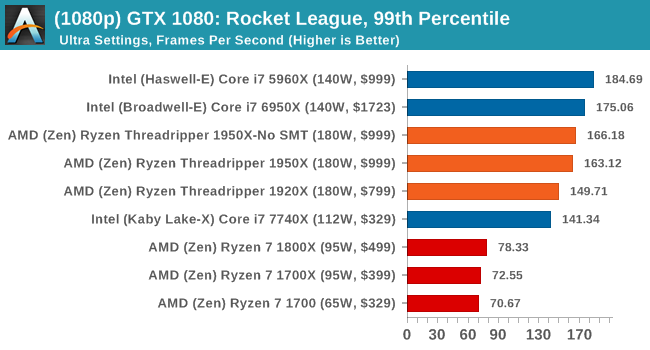
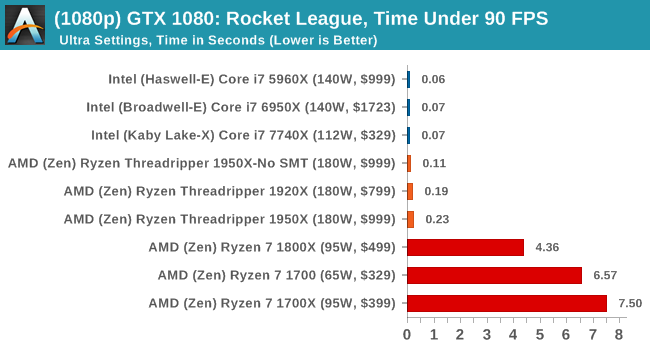
MSI GTX 1080 Gaming 8G Performance
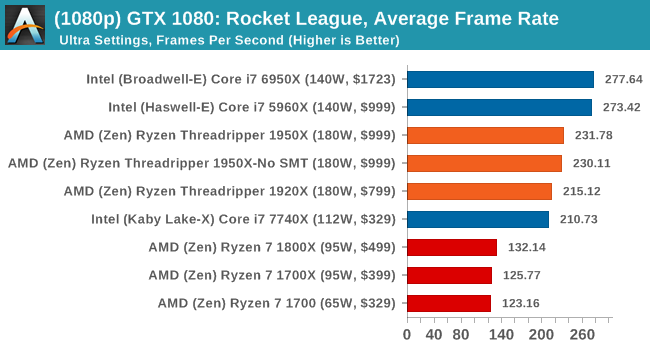
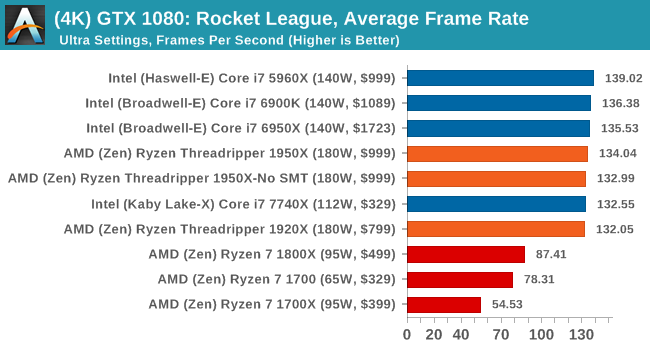
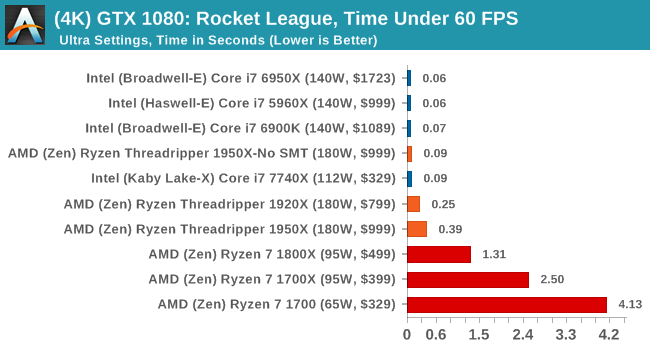
1080p
4K

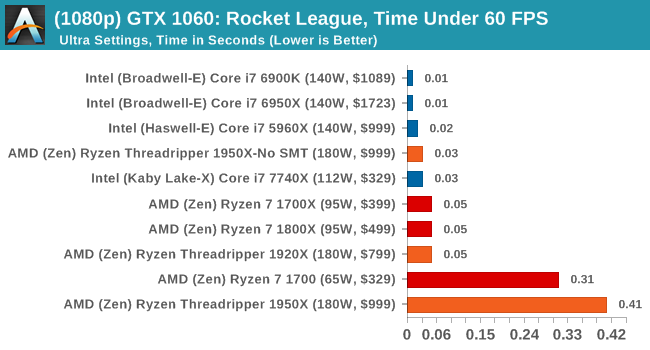
ASUS GTX 1060 Strix 6G Performance
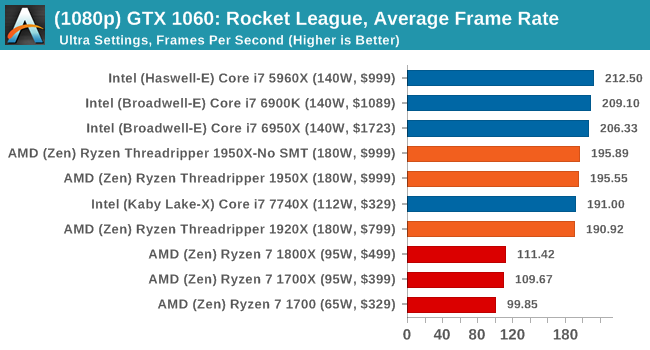
1080p
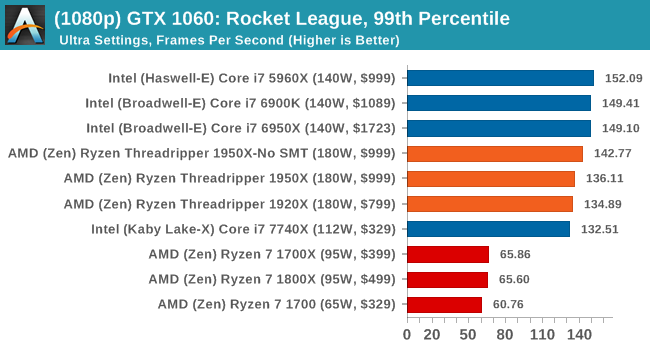
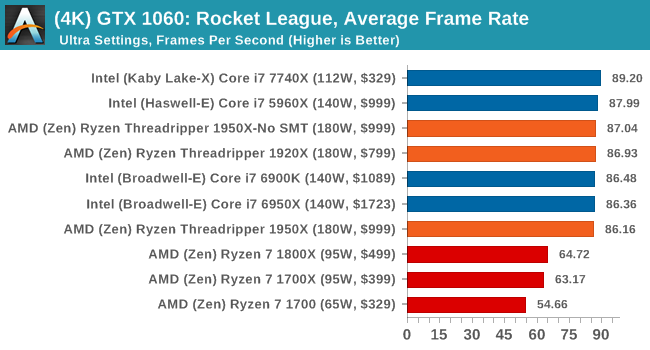
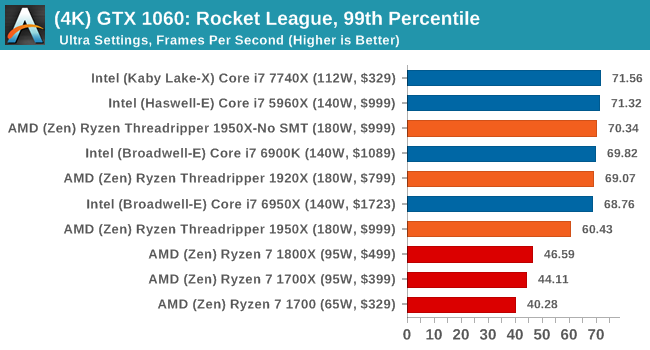
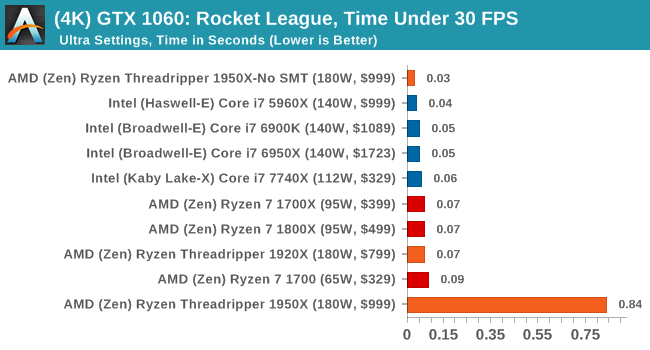
4K
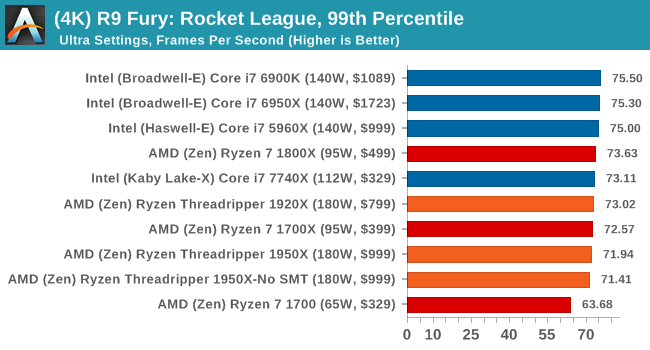
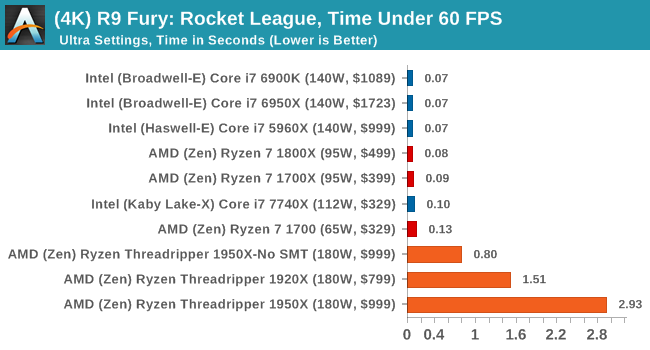
Sapphire Nitro R9 Fury 4G Performance
1080p
4K
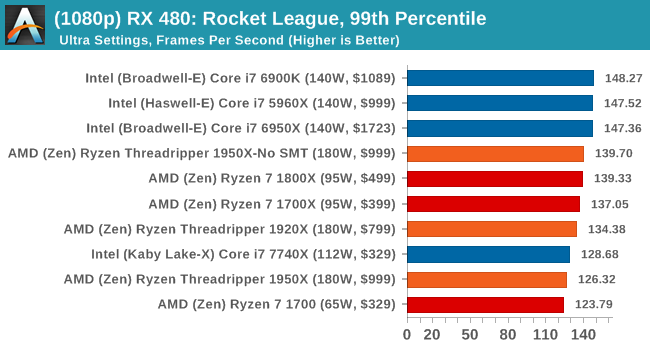
Sapphire Nitro RX 480 8G Performance
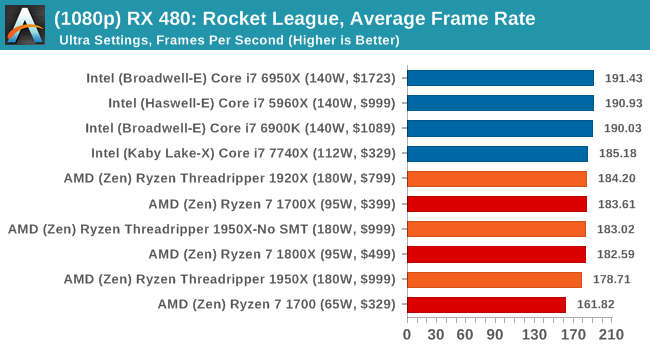
1080p
4K
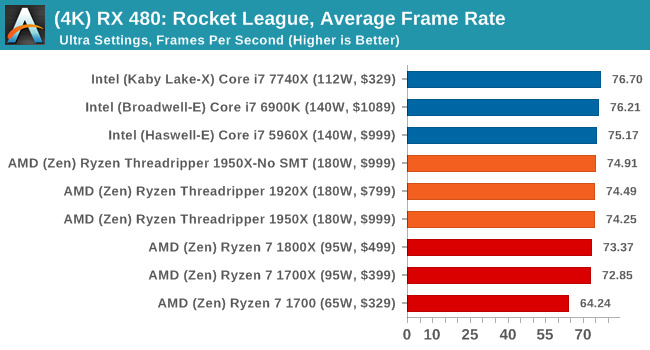
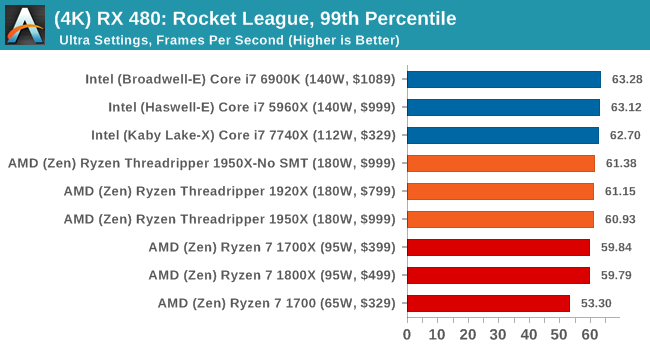
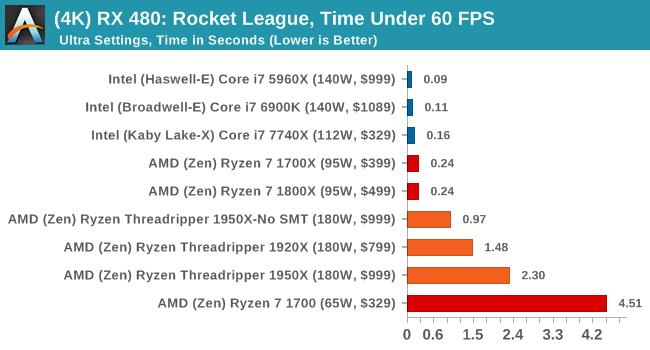
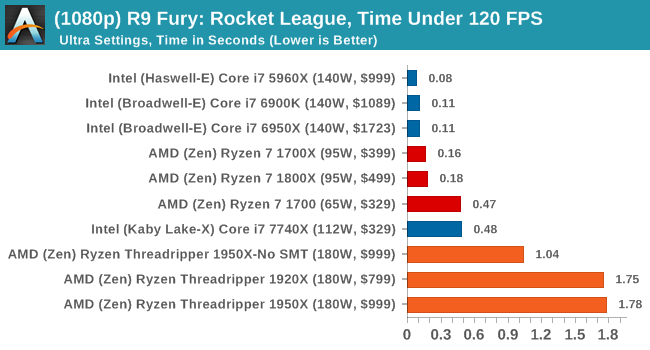
With Ryzen, we encounted some odd performance issues when using NVIDIA-based video cards that caused those cards to significantly underperform. However equally strangely, the issues we have with Ryzen on Rocket League with NVIDIA GPUs seem to almost vanish when using Threadripper. Again, still no easy wins here as Intel seems to take Rocket League in its stride, but SMT-off mode still helps the 1950X. The Time Under graphs give some cause for concern, with the 1950X consistently being at the bottom of that graph.


347 Comments
View All Comments
blublub - Sunday, August 13, 2017 - link
From what I have read is that all TR do 3.9hhz and some even 4-4.1ghz on all cores .What are your temp when running all 10c @4.6ghz prime for 1-2hrs
Zingam - Sunday, August 13, 2017 - link
Ian, how about testing mobile CPUs - for games and for office work. Aren't mobile CPUs selling much larger numbers thatn desktop ones these days?I can't find a single benchmark comparing i5-7300hq vs i7-7700hq vs i7-7700K showing the difference in productivity workloads and not just for rendering pretty pictures but also for more specific tasks as compiling software etc.
I also would like to see some sort of comparison of new generation to all generations upto 10 years back in time. I'd like to know how much did performance increase since the age of Nehelem. At least from now on there should be a single test to display the relative performance increase over the last few generations. The average user doesn't upgrade their PC every year. The average user maybe upgrades every 5 years and it is really difficult to find out how much peformance increase would one get with an upgrade.
SanX - Sunday, August 13, 2017 - link
I agree, there must be 5-7 years old processors in the chartsSanX - Sunday, August 13, 2017 - link
Why one core of Apple A10 costs $10 but one core of Intel 7900x costs 10x more?oranos - Sunday, August 13, 2017 - link
so its complete dogsh*t for the segment which is driving the PC market right now: gaming. got it.ballsystemlord - Sunday, August 13, 2017 - link
Hey Ian, you've been talking about anandtech's great database where we can see all the cool info. Well, according to your database the Phenom II 6 core 1090T is equally powerful when compared to the 16 core threadripper!!!!!!! http://www.anandtech.com/bench/product/1932?vs=146With those sorts of numbers why would anyone plan an upgrade?
(And there is also only one metric displayed, strange!)
Not to play the Intel card on you as others do, but this is a serious problem for at least the AMD lineup of processors.
jmelgaard - Monday, August 14, 2017 - link
o.O... I don't know how you derived that conclusion? you need a guide on how to read the database?...BurntMyBacon - Monday, August 14, 2017 - link
For anyone looking for an overall fps for two pass encoding here is your equation (hope my math is correct):FPS = 2*FPS1*FPS2/(FPS2+FPS1)
No, you can't just average the FPS scores from each pass as the processor will spend more time in the slower pass.
For the x264 encoding test, for example, a few relevant FPS scores end up being:
i9-7900X: 122.56
i7-7820X: 114.37
i7-6900K: 95.26
i7-7740X: 82.74
TR-1950X: 118.13
TR-1950X(g): 117.00
TR-1920X: 111.74
R7-1800X: 100.19
Since two pass encoding requires both passes to be usable, getting an overall FPS score seems somewhat relevant. Alternately, using time to completion is would present the same information in a different manner. Though, it would be difficult to extrapolate performance results to estimate performance in other encodes without also posting the number of frames encoded.
goldgrenade - Thursday, January 4, 2018 - link
Take all those Intel FPS performance counters and multiply them by .7 and you have what their chips actually run at without a major security flaw in them.Let's see that would be...
i9-7900X: 85.792
i7-7820X: 80.059
i7-6900K: 66.682
i7-7740X: 57.918
And that's at best. It can be up to 50% degradation when rendering or having to do many small file accesses or repeated operations with KAISER.
Gastec - Tuesday, August 15, 2017 - link
I've having a hard time trying to swallow "Threadripper is a consumer focused product" line considering the prices to "consume" it: $550 for the MB, $550 for the TR1900X ($800 or $1000 for the others is just dreaming) then the RAM. The MB(at least the Asus one) should be $200 less, but I get it, they are trying to squeeze as much as possible from the...consumers. Now don't get me wrong and I mean no offence for the rich ones among you, but those CPU are for Workstations. WORK, not gamestations. Meaning you would need them to help you make your money, faster.