The AMD Ryzen 3 1300X and Ryzen 3 1200 CPU Review: Zen on a Budget
by Ian Cutress on July 27, 2017 9:30 AM EST- Posted in
- CPUs
- AMD
- Zen
- Ryzen
- Ryzen 3
- Ryzen 3 1300X
- Ryzen 3 1200
Benchmarking Performance: CPU System Tests
Our first set of tests is our general system tests. These set of tests are meant to emulate more about what people usually do on a system, like opening large files or processing small stacks of data. This is a bit different to our office testing, which uses more industry standard benchmarks, and a few of the benchmarks here are relatively new and different.
All of our benchmark results can also be found in our benchmark engine, Bench.
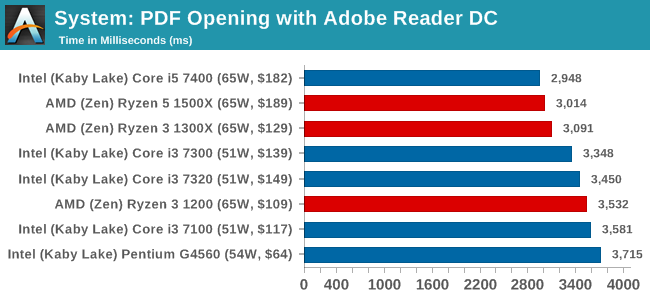
PDF Opening
First up is a self-penned test using a monstrous PDF we once received in advance of attending an event. While the PDF was only a single page, it had so many high-quality layers embedded it was taking north of 15 seconds to open and to gain control on the mid-range notebook I was using at the time. This put it as a great candidate for our 'let's open an obnoxious PDF' test. Here we use Adobe Reader DC, and disable all the update functionality within. The benchmark sets the screen to 1080p, opens the PDF to in fit-to-screen mode, and measures the time from sending the command to open the PDF until it is fully displayed and the user can take control of the software again. The test is repeated ten times, and the average time taken. Results are in milliseconds.
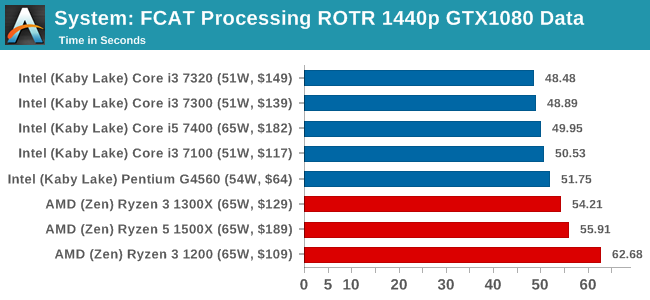
FCAT Processing: link
One of the more interesting workloads that has crossed our desks in recent quarters is FCAT - the tool we use to measure stuttering in gaming due to dropped or runt frames. The FCAT process requires enabling a color-based overlay onto a game, recording the gameplay, and then parsing the video file through the analysis software. The software is mostly single-threaded, however because the video is basically in a raw format, the file size is large and requires moving a lot of data around. For our test, we take a 90-second clip of the Rise of the Tomb Raider benchmark running on a GTX 980 Ti at 1440p, which comes in around 21 GB, and measure the time it takes to process through the visual analysis tool.
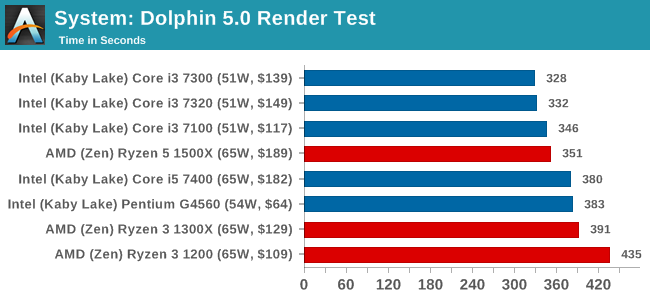
Dolphin Benchmark: link
Many emulators are often bound by single thread CPU performance, and general reports tended to suggest that Haswell provided a significant boost to emulator performance. This benchmark runs a Wii program that ray traces a complex 3D scene inside the Dolphin Wii emulator. Performance on this benchmark is a good proxy of the speed of Dolphin CPU emulation, which is an intensive single core task using most aspects of a CPU. Results are given in minutes, where the Wii itself scores 17.53 minutes.
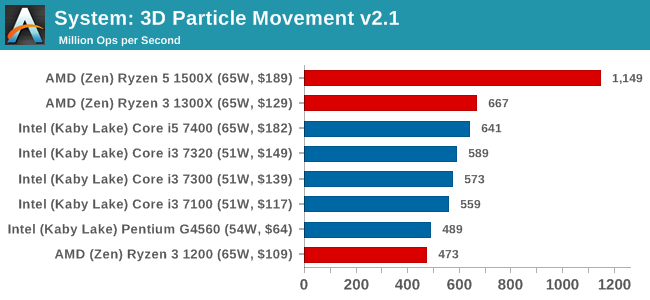
3D Movement Algorithm Test v2.1: link
This is the latest version of the self-penned 3DPM benchmark. The goal of 3DPM is to simulate semi-optimized scientific algorithms taken directly from my doctorate thesis. Version 2.1 improves over 2.0 by passing the main particle structs by reference rather than by value, and decreasing the amount of double->float->double recasts the compiler was adding in. It affords a ~25% speed-up over v2.0, which means new data.
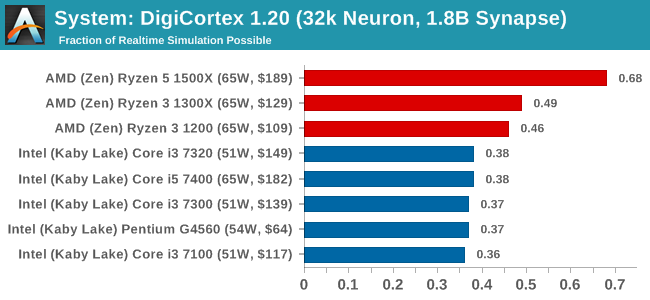
DigiCortex v1.20: link
Despite being a couple of years old, the DigiCortex software is a pet project for the visualization of neuron and synapse activity in the brain. The software comes with a variety of benchmark modes, and we take the small benchmark which runs a 32k neuron/1.8B synapse simulation. The results on the output are given as a fraction of whether the system can simulate in real-time, so anything above a value of one is suitable for real-time work. The benchmark offers a 'no firing synapse' mode, which in essence detects DRAM and bus speed, however we take the firing mode which adds CPU work with every firing.
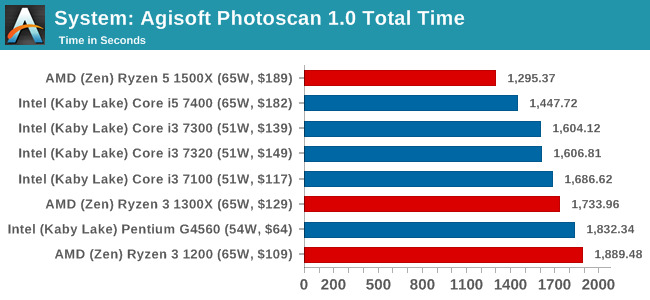
Agisoft Photoscan 1.0: link
Photoscan stays in our benchmark suite from the previous version, however now we are running on Windows 10 so features such as Speed Shift on the latest processors come into play. The concept of Photoscan is translating many 2D images into a 3D model - so the more detailed the images, and the more you have, the better the model. The algorithm has four stages, some single threaded and some multi-threaded, along with some cache/memory dependency in there as well. For some of the more variable threaded workload, features such as Speed Shift and XFR will be able to take advantage of CPU stalls or downtime, giving sizeable speedups on newer microarchitectures.


140 Comments
View All Comments
Oxford Guy - Thursday, July 27, 2017 - link
"The Ryzen 3 1200 brings up the rear of the stack, being the lowest CPU in the stack, having the lowest frequency at 3.1G base, 3.4G turbo, 3.1G all-core turbo, no hyperthreading and the lowest amount of L3 cache."That bit about the L3 is incorrect unless the chart on page 1 is incorrect. It shows the same L3 size for 1400, 1300X, and 1200.
Oxford Guy - Thursday, July 27, 2017 - link
And this:"Number 3 leads to a lop-sided silicon die, and obviously wasn’t chosen."
Obviously?
Oxford Guy - Thursday, July 27, 2017 - link
"DDR4-2400 C15"2400, really — even though it is, obviously, known that Zen needs faster RAM to perform efficiently?
Joel Hruska managed to test Ryzen with 3200 speed RAM on his day 1 review. I bought 16 GB of 3200 RAM from Microcenter last Christmastime for $80. Just because RAM prices are nuts right now doesn't mean we should gut Ryzen's performance by sticking it with low-speed RAM.
Oxford Guy - Thursday, July 27, 2017 - link
"This is also typically run at JEDEC subtimings where possible. It is noted that some users are not keen on this policy"Maybe you guys should rethink your logic.
1) You have claimed, when overclocking, that it's not necessary to do full stability testing, like with Prime. Just passing some lower-grade stress testing is enough to make an overclock "stable enough".
2) Your overclocking reviews have pushed unwise levels of voltage into CPUs to go along with this "stable enough" overclock.
So... you argue against proof of true stability, both in the final overclock settings being satisfactorily tested and in safe voltages being decided upon.
And — simultaneously — kneecap Zen processors by using silly JEDEC standards, trying to look conservative?
Please.
Everyone knows the JEDEC standard applies to enterprise. Patriot is just one manufacturer of RAM that tested and certified far better RAM performance on B350 and A320 Zen boards. You had that very article on your site just a short time ago.
Your logic doesn't add up. It is not a significant enough cost savings for system builders to go with slow RAM for Zen. The only argument you can use, at all, is that OEMs are likely to kneecap Zen with slow RAM. That is not a given, though. OEMs can use faster RAM, like, at least, 2666, if they choose to. If they're marketing toward gamers they likely will.
Oxford Guy - Thursday, July 27, 2017 - link
"Truth be told I never actually played the first version, but every edition from the second to the sixth, including the fifth as voiced by the late Leonard Nimoy"You mean Civ IV.
Oxford Guy - Thursday, July 27, 2017 - link
And, yeah, we can afford to test with an Nvidia 1080 but we can't afford to use decent speed RAM.Yeah... makes sense.
Hixbot - Thursday, July 27, 2017 - link
Are you having a conversation with yourself? Try to condense your points into a single post.Oxford Guy - Friday, July 28, 2017 - link
I don't live in a static universe where all of the things I'm capable of thinking of are immediately apparent, but thanks for the whine.Manch - Friday, July 28, 2017 - link
Really snowflake? You're saying he is whining? How many rants have you posted? LOL The difference between 2400 and 3200 shows up more on the higher end processors bc bigger L3 & HT err SMT. The diff in CPU bound gaming is 5-10% at most with the Ryzen 7's. Smaller with the 5's. Even more so with the 3's. Small enough to the point that it would not change the outlook on the CPU's. Also consider that if Ian change the parameters of his test constantly it would also skew numbers more so and render bench unreliable. Test the Ryzen 7's with 2133 then the 5's with 2400 then the 3's with 3200? Obviously anandtechs test are not the definitive performance bench mark for the world. What it is, is a reliably consistent benchmark allowing you to compare diff cpus with as little changed as possible as too not skew performance. Think EPA gas mileage stickers on cars. Will you get that rating? maybe. What it does is it gives you comparative results. From there its fairly easy to extrapolate the difference. Now I'm sure they will as they have in the past update there baseline specs for testing. You're running off the rails about how much the memory effects are. Look at all the youtube vids and other reviews out there. Difference yes. A lot? meh I also believe anandtech has mentioned doing a write up on the latest agesa update since its had a significant impact(including memory) on the series.Oxford Guy - Friday, July 28, 2017 - link
"You're saying he is whining? How many rants have you posted?"Pot kettle fallacy.