The Intel Skylake-X Review: Core i9 7900X, i7 7820X and i7 7800X Tested
by Ian Cutress on June 19, 2017 9:01 AM ESTComparing Skylake-S and Skylake-X/SP Performance Clock-for-Clock
If you’ve read through the full review up to this point (and kudos), there should be three things that stick in the back of your mind about the new Skylake-SP cores: Cache, Mesh and AVX512. These are the three main features that separate the consumer grade Skylake-S core from this new core, and all three can have an impact in clock-for-clock performance. Even though the Skylake-S and the Skylake-SP are not competing in the same markets, it is still poignant to gather how much the changes affect the regular benchmark suite.
For this test, we took the Skylake-S based Core i5-6600 and the Skylake-SP based Core i9-7900X and ran them both with only 4 cores, no hyperthreading, and 3 GHz on all cores with no Turbo active. Both CPUs were run in high performance modes in the OS to restrict any time-to-idle, so it is worth noting here that we are not measuring power. This is just raw throughput.
Both of these cores support different DRAM frequencies, however: the i5-6600 lists DDR4-2133 as its maximum supported frequency, whereas the i9-7900X will run at DDR4-2400 at 2DPC. I queried a few colleagues as to what I should do here – technically the memory support is an extended element of the microarchitecture, and the caches/uncore/untile will be running at different frequencies, so how much of the system support should be chipped away for parity. The general consensus was to test with the supported frequencies, given this is how the parts ship.
For this analysis, each test was broken down in two ways: what sort of benchmark (single thread, multi-thread, mixed) and what category of benchmark (web, office, encode).
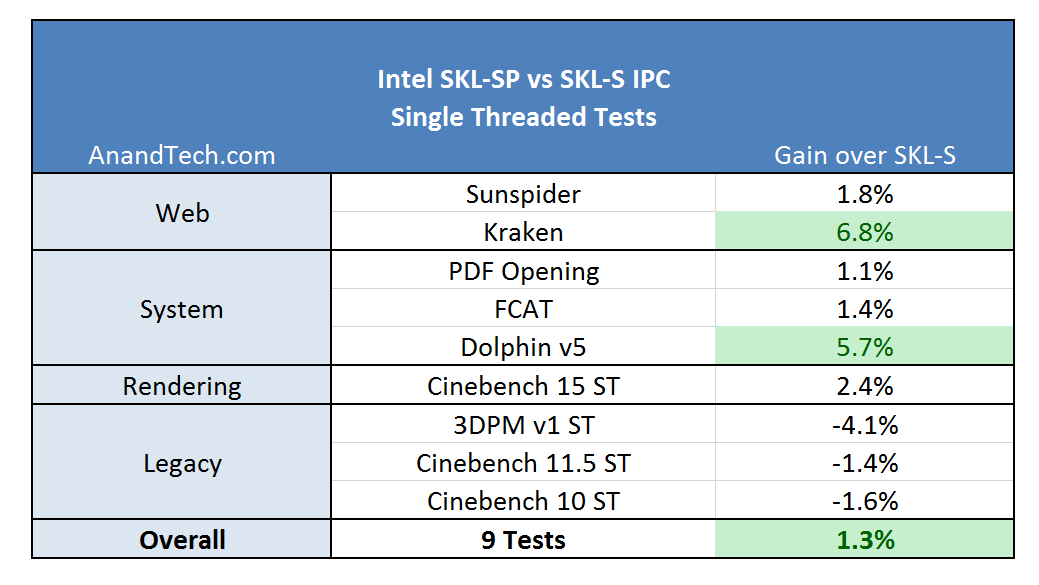
For the single threaded tests, results were generally positive. Kraken enjoyed the L2, and Dolphin emulation had a good gain as well. The legacy tests did not fair that great: 3DPM v1 has false sharing, which is likely taking a hit due to the increased L2 latency.
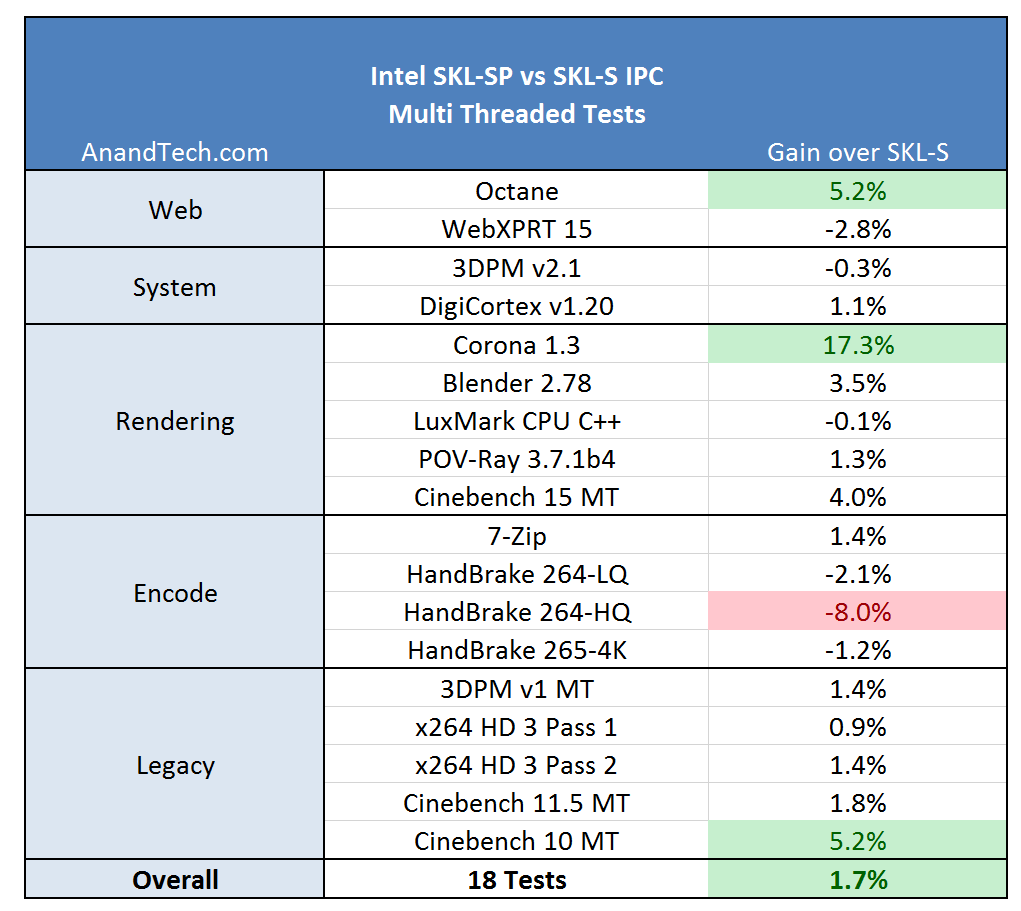
On the multithreaded tests, the big winner here was Corona. Corona is a high-performance renderer for Autodesk 3ds Max, showing that the larger L2 does a good job with its code base. The step back was in Handbrake – our testing does not implement any AVX512 code, but the L3 victim cache might be at play here over the L3 inclusive cache in SKL-S.
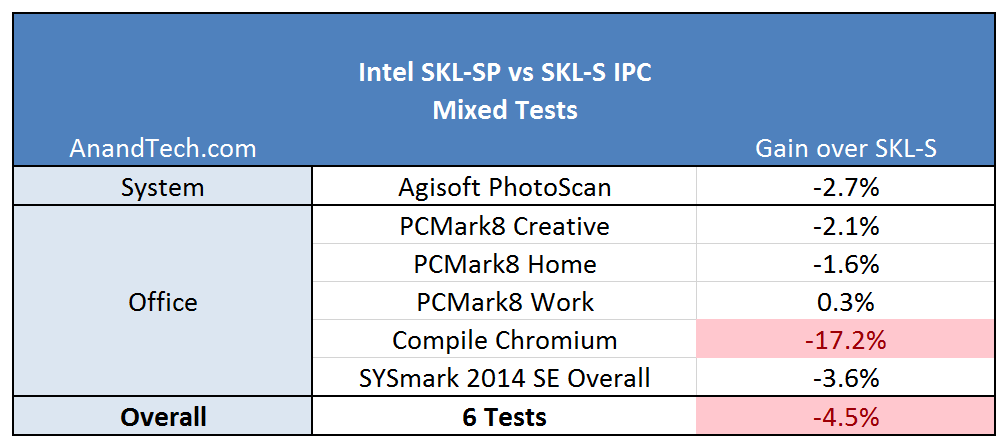
The mixed results are surprising: these tests vary with ST and MT parts to their computation, some being cache sensitive as well. The big outlier here is the compile test, indicating that the Skylake-SP might not be (clock for clock) a great compilation core. This is a result we can trace back to the L3 again, being a smaller non-inclusive cache. In our results database, we can see similar results when comparing a Ryzen 7 1700X, an 8-core 95W CPU with 16MB of L3 victim cache, is easily beaten by a Core i7-7700T, with 4 cores at 35W but has 8MB of inclusive L3 cache.
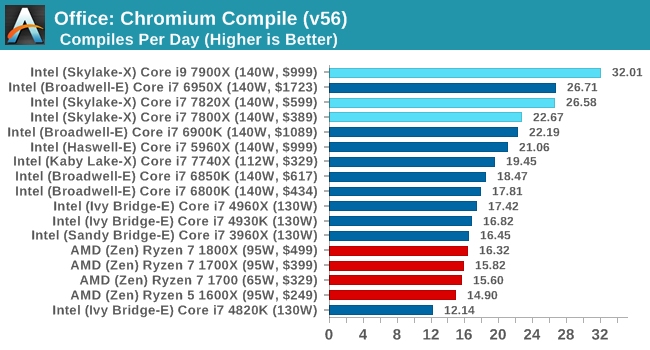
If we treat each of these tests with equal weighting, the overall result will offer a +0.5% gain to the new Skylake-SP core, which is with the margin of error. Nothing too much to be concerned about for most users (except perhaps people who compile all day), although again, these two cores are not in chips that directly compete. The 10-core SKL-SP chip still does the business on compiling:
If all these changes (minus AVX512) offer a +0.5% gain over the standard Skylake-S core, then one question worth asking is what was the point? The answer is usually simple, and I suspect involves scaling (moving to chips with more cores), but also customer related. Intel’s big money comes from the enterprise, and no doubt some of Intel’s internal metrics (as well as customer requests) point to a sizeable chunk of enterprise compute being L2 size limited. I’ll be looking forward to Johan’s review on the enterprise side when the time comes.


264 Comments
View All Comments
geekman1024 - Monday, June 19, 2017 - link
Zen is winning in one department: Price.Lolimaster - Tuesday, June 20, 2017 - link
Ryzen has a sick efficiency at lower clocks, that Ryzen 7 1700 65w can de undervolted further more and make it a 50w 3Ghz monster.sir_tech - Monday, June 19, 2017 - link
Why there are no power consumption charts in the review? Also, you should have gone ahead and post the gaming performance charts also just like Ryzen reviews.While the MSRP is high the actual retail price for Ryzen processors retail prices are much lower now.
Ryzen 7 1800x - $439 (MSRP - $499)
Ryzen 7 1700x - $349 (MSRP - $399)
Ryzen 7 1700 - $299 (MSRP - $329)
Ryzen 5 1600x - $229 (MSRP - $249)
Ryan Smith - Monday, June 19, 2017 - link
"Why there are no power consumption charts in the review?"Please refresh the conclusion.=)
"Also, you should have gone ahead and post the gaming performance charts also just like Ryzen reviews."
The BIOS updates have come so late that we don't even have a complete dataset for the new BIOSes. Ian had just enough time to make sure they were still screwy, and then was on a plane. We're going to need to sit down and completely redo all the Skylake-X chips once the platform stabilizes to the point where our results won't be immediately invalidated.
cheshirster - Monday, June 19, 2017 - link
Your DDR4-2400 tests of 1800X and 1600X are already invalidated.And RoTR
There was no problem with publishing bad gaming results for AMD.
What's the problem with 2066?
Ryan Smith - Monday, June 19, 2017 - link
If we had a complete, up-to-date dataset to publish, and time to write it up, we would have. If only to showcase why eager gamers should wait for the platform to mature a bit.cheshirster - Monday, June 19, 2017 - link
Sorry, with this text:"Our GTX1080 seems to be hit the hardest out of our four GPUs, as well as Civilization 6, the second Rise of the Tomb Raider test, and Rocket League on all GPUs. As a result, we only posted a minor selection of results, most of which show good parity at 4K"
+ ryzen bad fullhd results in RoTR and Rocket League fully published.
You are going straigh to the Hall of Fame of typical brand loyalists.
jospoortvliet - Thursday, June 22, 2017 - link
Well the state of Ryzen wasn't as bad as this and it isn't like it was not pointed out in this review.Also I am sure other benchmarks were also affected making Intel look worse in benchmark databases thanks to their rush job...
bongey - Wednesday, August 2, 2017 - link
Yep you bashed Ryzen in gaming in your review, quit lying."Gaming Performance, particularly towards 240 Hz gaming, is being questioned,"
Gasaraki88 - Monday, June 19, 2017 - link
Everything is on default, no overclocking.