The AMD Ryzen 5 1600X vs Core i5 Review: Twelve Threads vs Four at $250
by Ian Cutress on April 11, 2017 9:00 AM ESTBenchmarking Performance: CPU System Tests
Our first set of tests is our general system tests. These set of tests are meant to emulate more about what people usually do on a system, like opening large files or processing small stacks of data. This is a bit different to our office testing, which uses more industry standard benchmarks, and a few of the benchmarks here are relatively new and different.
PDF Opening
First up is a self-penned test using a monstrous PDF we once received in advance of attending an event. While the PDF was only a single page, it had so many high-quality layers embedded it was taking north of 15 seconds to open and to gain control on the mid-range notebook I was using at the time. This put it as a great candidate for our 'let's open an obnoxious PDF' test. Here we use Adobe Reader DC, and disable all the update functionality within. The benchmark sets the screen to 1080p, opens the PDF to in fit-to-screen mode, and measures the time from sending the command to open the PDF until it is fully displayed and the user can take control of the software again. The test is repeated ten times, and the average time taken. Results are in milliseconds.
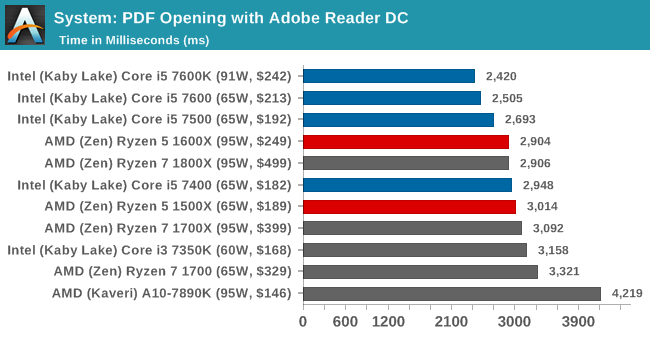
Opening PDFs using Adobe is significantly single threaded, hence why Intel takes the win here for the most part - the 7400 is slightly lower on frequency, enough for the 4.0 GHz Ryzen parts to push ahead.
FCAT Processing
One of the more interesting workloads that has crossed our desks in recent quarters is FCAT - the tool we use to measure stuttering in gaming due to dropped or runt frames. The FCAT process requires enabling a color-based overlay onto a game, recording the gameplay, and then parsing the video file through the analysis software. The software is mostly single-threaded, however because the video is basically in a raw format, the file size is large and requires moving a lot of data around. For our test, we take a 90-second clip of the Rise of the Tomb Raider benchmark running on a GTX 980 Ti at 1440p, which comes in around 21 GB, and measure the time it takes to process through the visual analysis tool.
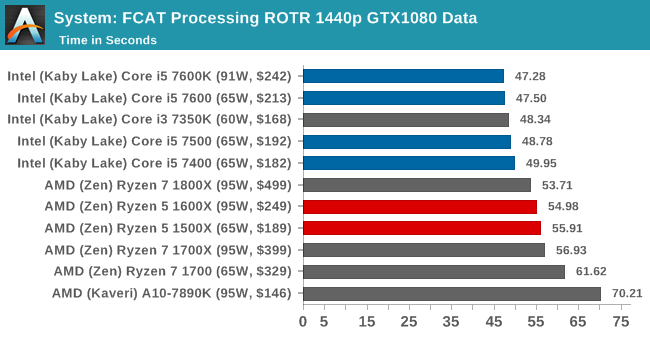
Similarly, FCAT is single threaded as it analyzes frame-by-frame. The extra frequency helps Intel here.
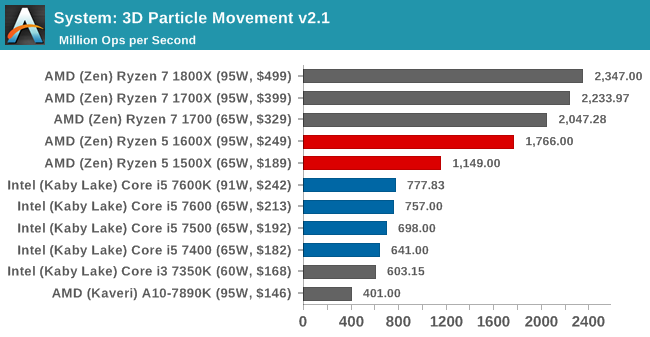
3D Particle Movement v2.1
This is the latest version of the self-penned 3DPM benchmark. The goal of 3DPM is to simulate semi-optimized scientific algorithms taken directly from my doctorate thesis. Version 2.1 improves over 2.0 by passing the main particle structs by reference rather than by value, and decreasing the amount of double->float->double recasts the compiler was adding in. It affords a ~25% speed-up over v2.0, which means new data.
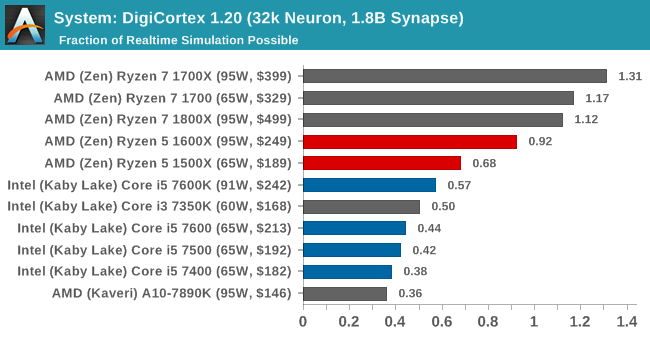
DigiCortex 1.20
Despite being a couple of years old, the DigiCortex software is a pet project for the visualization of neuron and synapse activity in the brain. The software comes with a variety of benchmark modes, and we take the small benchmark which runs a 32k neuron/1.8B synapse simulation. The results on the output are given as a fraction of whether the system can simulate in real-time, so anything above a value of one is suitable for real-time work. The benchmark offers a 'no firing synapse' mode, which in essence detects DRAM and bus speed, however we take the firing mode which adds CPU work with every firing.
Agisoft Photoscan 1.0
Photoscan stays in our benchmark suite from the previous version, however now we are running on Windows 10 so features such as Speed Shift on the latest processors come into play. The concept of Photoscan is translating many 2D images into a 3D model - so the more detailed the images, and the more you have, the better the model. The algorithm has four stages, some single threaded and some multi-threaded, along with some cache/memory dependency in there as well. For some of the more variable threaded workload, features such as Speed Shift and XFR will be able to take advantage of CPU stalls or downtime, giving sizeable speedups on newer microarchitectures.
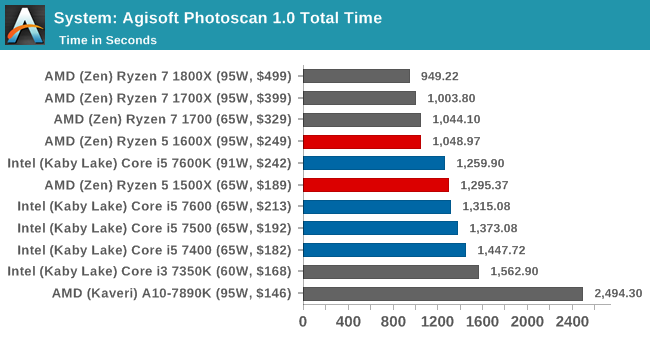
Because parts of Photoscan are very multithreaded, such as the first stage, there's plenty of scope for the Ryzen CPUs to pull ahead here.


254 Comments
View All Comments
Shadowmaster625 - Tuesday, April 11, 2017 - link
The main reason to buy a 7600K over Ryzen is so you can actually go above 4.1GHz. Given how easy it is to clock a 7600K at 4.7GHz or even higher, it is highly disingenuous to not include overclocked results on the graphs.sor - Tuesday, April 11, 2017 - link
I think the overclocking niche is aware that they can do better. I agree that more data is better, but I certainly don't think there's any responsibility for Anandtech to provide overclocking results for either platform.Maybe they'll follow up with a comparison on how Ryzen 5 overclocked compared to the competition.
Meteor2 - Wednesday, April 12, 2017 - link
How much does OC'ing help? Presumably not at all with gaming unless you're on a 1080 or higher, and how does it help multi-threaded production workloads?Notmyusualid - Tuesday, April 18, 2017 - link
My thoughts exactly - my buddies' 7600K runs 24/7 @ 5GHz, on a 240mm closed loop rad.It was the snappiest computer I've yet used...
dhotay - Tuesday, April 11, 2017 - link
*shoo-inhttps://www.merriam-webster.com/dictionary/shoo-in
Achaios - Tuesday, April 11, 2017 - link
"We have already shown in previous reviews that the Zen microarchitecture from AMD is around the equivalent of Intel’s Broadwell microarchitecture"I don't think so, Ian. Case in point:
1. Intel Core i7-7700K @ 4.20GHz- 4.50 GHz Turbo (KABY LAKE): 2,595 MARKS PASSMARK SINGLE THREADED
2. Intel Core i7-6950X @ 3.00GHz- 3.50 GHz Turbo (BROADWELL): 2,135 MARKS PASSMARK SINGLE THREADED
3. AMD 1800X 3.6 GHz - 4.0 GHz Turbo(RYZEN): 1,952 MARKS PASSMARK SINGLE THREADED
Out of curiosity, I benched my own 4770k at 4.5 GHZ, the frequency I game on:
4. Intel 4770K 3.50 GHz - 4.53 GHz OC (HASWELL): 2610 MARKS PASSMARK SINGLE THREADED
http://imgur.com/FrHmYlG
It's not even the bloody equivalent of Haswell, man, much less that of Broadwell.
sor - Tuesday, April 11, 2017 - link
No, you're cherry picking. It's pretty well documented that IPC is about broadwell level, if you want to get into a benchmark posting war you'll run out of material far sooner. I can even find huge wins for Ryzen, but I'm not going to cherry pick those to try to show a big discrepancy.Achaios - Tuesday, April 11, 2017 - link
How about you go ahead and cherrypick to prove me wrong on Single Threaded performance. Oh now wait, you can't b/c Ryzen is slow as molasses in January.https://www.cpubenchmark.net/singleThread.html
MrSpadge - Tuesday, April 11, 2017 - link
Apart from WinrAR 5.2 that's pretty slippery molasses:http://www.zolkorn.com/en/amd-ryzen-7-1800x-vs-int...
fanofanand - Tuesday, April 11, 2017 - link
And the cherry picking continues."How about you go ahead and cherrypick to prove me wrong on Single Threaded performance"