The AMD Ryzen 5 1600X vs Core i5 Review: Twelve Threads vs Four at $250
by Ian Cutress on April 11, 2017 9:00 AM ESTBenchmarking Performance: CPU System Tests
Our first set of tests is our general system tests. These set of tests are meant to emulate more about what people usually do on a system, like opening large files or processing small stacks of data. This is a bit different to our office testing, which uses more industry standard benchmarks, and a few of the benchmarks here are relatively new and different.
PDF Opening
First up is a self-penned test using a monstrous PDF we once received in advance of attending an event. While the PDF was only a single page, it had so many high-quality layers embedded it was taking north of 15 seconds to open and to gain control on the mid-range notebook I was using at the time. This put it as a great candidate for our 'let's open an obnoxious PDF' test. Here we use Adobe Reader DC, and disable all the update functionality within. The benchmark sets the screen to 1080p, opens the PDF to in fit-to-screen mode, and measures the time from sending the command to open the PDF until it is fully displayed and the user can take control of the software again. The test is repeated ten times, and the average time taken. Results are in milliseconds.
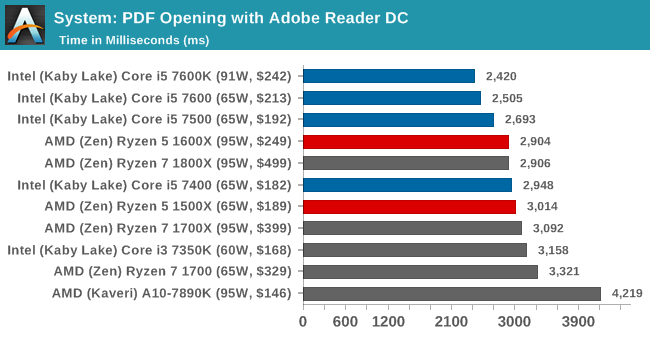
Opening PDFs using Adobe is significantly single threaded, hence why Intel takes the win here for the most part - the 7400 is slightly lower on frequency, enough for the 4.0 GHz Ryzen parts to push ahead.
FCAT Processing
One of the more interesting workloads that has crossed our desks in recent quarters is FCAT - the tool we use to measure stuttering in gaming due to dropped or runt frames. The FCAT process requires enabling a color-based overlay onto a game, recording the gameplay, and then parsing the video file through the analysis software. The software is mostly single-threaded, however because the video is basically in a raw format, the file size is large and requires moving a lot of data around. For our test, we take a 90-second clip of the Rise of the Tomb Raider benchmark running on a GTX 980 Ti at 1440p, which comes in around 21 GB, and measure the time it takes to process through the visual analysis tool.
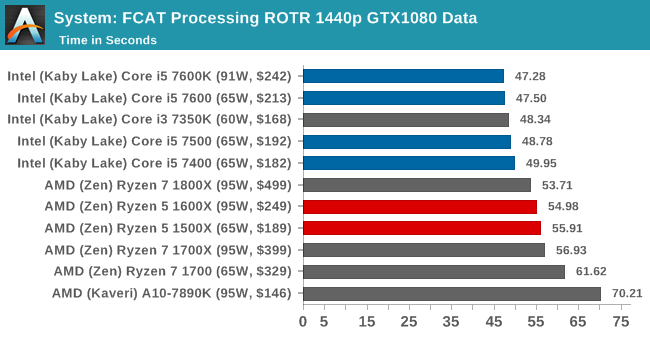
Similarly, FCAT is single threaded as it analyzes frame-by-frame. The extra frequency helps Intel here.
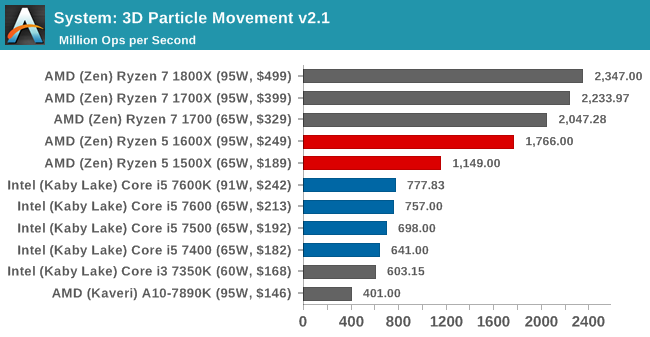
3D Particle Movement v2.1
This is the latest version of the self-penned 3DPM benchmark. The goal of 3DPM is to simulate semi-optimized scientific algorithms taken directly from my doctorate thesis. Version 2.1 improves over 2.0 by passing the main particle structs by reference rather than by value, and decreasing the amount of double->float->double recasts the compiler was adding in. It affords a ~25% speed-up over v2.0, which means new data.
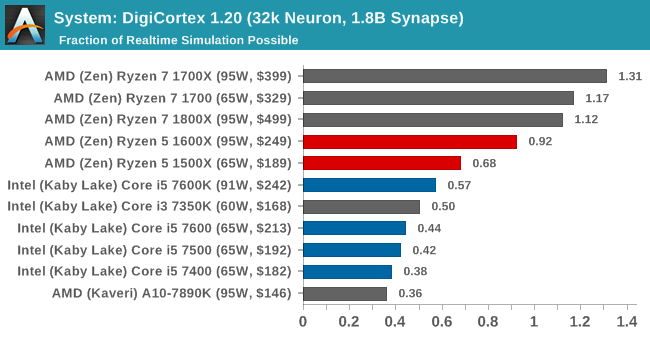
DigiCortex 1.20
Despite being a couple of years old, the DigiCortex software is a pet project for the visualization of neuron and synapse activity in the brain. The software comes with a variety of benchmark modes, and we take the small benchmark which runs a 32k neuron/1.8B synapse simulation. The results on the output are given as a fraction of whether the system can simulate in real-time, so anything above a value of one is suitable for real-time work. The benchmark offers a 'no firing synapse' mode, which in essence detects DRAM and bus speed, however we take the firing mode which adds CPU work with every firing.
Agisoft Photoscan 1.0
Photoscan stays in our benchmark suite from the previous version, however now we are running on Windows 10 so features such as Speed Shift on the latest processors come into play. The concept of Photoscan is translating many 2D images into a 3D model - so the more detailed the images, and the more you have, the better the model. The algorithm has four stages, some single threaded and some multi-threaded, along with some cache/memory dependency in there as well. For some of the more variable threaded workload, features such as Speed Shift and XFR will be able to take advantage of CPU stalls or downtime, giving sizeable speedups on newer microarchitectures.
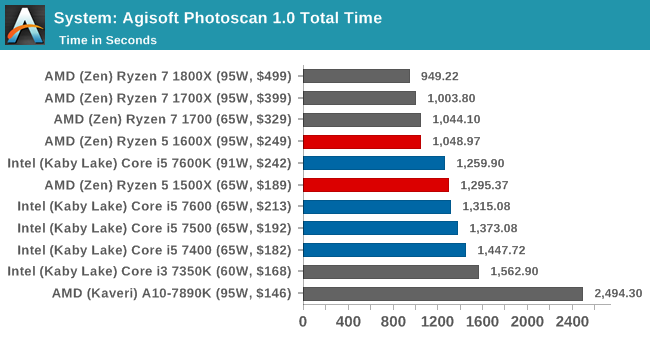
Because parts of Photoscan are very multithreaded, such as the first stage, there's plenty of scope for the Ryzen CPUs to pull ahead here.


254 Comments
View All Comments
Phiro69 - Tuesday, April 11, 2017 - link
Thank you Ian!Maybe at some point as part of your benchmark description you have a url to a page showing basic (e.g. exactly the level of information you provided above but not step by step hand holding) benchmark setup instructions. I know I wonder if I've configured my builds correctly when I put together new systems; I buy the parts based on benchmarks but I don't ever really validate they perform at that level/I have things set correctly.
qupada - Tuesday, April 11, 2017 - link
I was curious about this too. Obviously a direct comparison between your Windows test and my Linux one is going to be largely meaningless but I felt the need to try anyway. Since Linux is all I have, this is what we get.My Haswell-EP Xeon E5-1660v3 - approximately an i7-5960X with ECC RAM, and that CPU seems to be oft-compared to the 1800X you have put in your results - clocks in at 78:36 to compile Chromium (59.0.3063.4), or 18.31 compiles per day (hoorah for the pile of extra money I spent on it resulting in such a small performance margin). However that's for the entire process, from unpacking the tarball, compiling, then tarring and compressing the compiled result. My machine is running Gentoo, it was 'time emerge -OB chromium' (I didn't feel like doing it manually to get just the compile). Am I reading right you've used the result of timing the 'ninja' compile step only?
I only ask because there definitely could be other factors in play for this one - for the uninitiated reading this comment, Chromium is a fairly massive piece of software, the source tar.xz file for the version I tried is 496MB (decompressing to 2757MB), containing around 28,000 directories and a shade under 210,000 files. At that scale, filesystem cache is definitely going to come into play, I would probably expect a slightly different result for a freshly rebooted machine versus one where the compile was timed immediately after unpacking the source code and it was still in RAM (obviously less of a difference on an SSD, but probably still not none).
It is an interesting test metric though, and again I haven't done this on WIndows, but there is a chunk in the middle of the process that seems to be single-threaded on a Linux compile (probably around 10% of the total wall clock time), so it is actually quite nice that it will benefit from both multi-core and single-core performance and boost clocks.
Also with a heavily multi-threaded process of that sort of duration, probably a great test of how long you get before thermal throttling starts to hurt you. I have to admit I'm cheating a bit by watercooling mine (not overclocked though) so it'll happily run 3.3GHz on a base clock of 3.0 across all eight cores for hours on end at around ~45°C/115°F.
rarson - Tuesday, April 11, 2017 - link
14393.969 was released March 20th, any reason you didn't use that build?Ian Cutress - Friday, April 14, 2017 - link
Because my OS is already locked down for the next 12-18 months of testing.Konobi - Tuesday, April 11, 2017 - link
I don't know what's up with those FPS number in rocket league 1080p. I have ye olde FX-8350 @ 4.8GHz and a GTX 1070 @ 2.1GHz and I get 244fps max and 230FPS average at 1080p Ultra.Ian Cutress - Tuesday, April 11, 2017 - link
I'm running a 4x4 bot match on Aquadome. Automated inputs to mimic gameplay and camera switching / tricks, FRAPS over 4 minutes of a match.jfmonty2 - Wednesday, April 12, 2017 - link
Why Aquadome specifically? It's been criticized for performance issues compared to most of the other maps in the game, although the most recent update has improved that.Ian Cutress - Friday, April 14, 2017 - link
On the basis that it's the most strenuous map to test on. Lowest common denominator and all that.Adam Saint - Tuesday, April 11, 2017 - link
"Looking at the results, it’s hard to notice the effect that 12 threads has on multithreaded CPU tests"Perhaps you mean *not* hard to notice? :)
coder543 - Tuesday, April 11, 2017 - link
I agree. That was also confusing.