The AMD Ryzen 5 1600X vs Core i5 Review: Twelve Threads vs Four at $250
by Ian Cutress on April 11, 2017 9:00 AM ESTBenchmarking Performance: CPU Office Tests
The office programs we use for benchmarking aren't specific programs per-se, but industry standard tests that hold weight with professionals. The goal of these tests is to use an array of software and techniques that a typical office user might encounter, such as video conferencing, document editing, architectural modelling, and so on and so forth. At present we have two such tools to use.
PCMark8
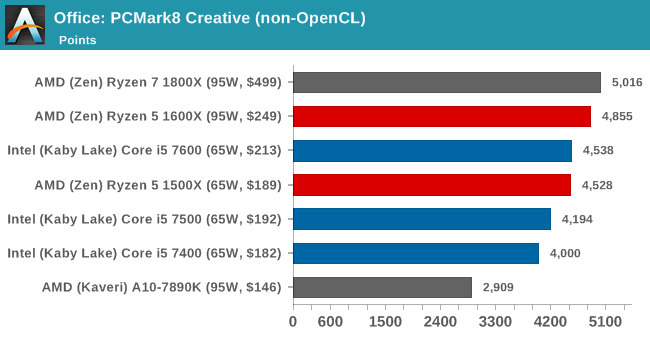
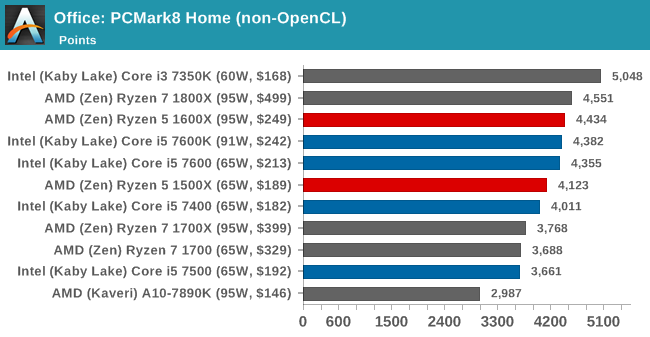
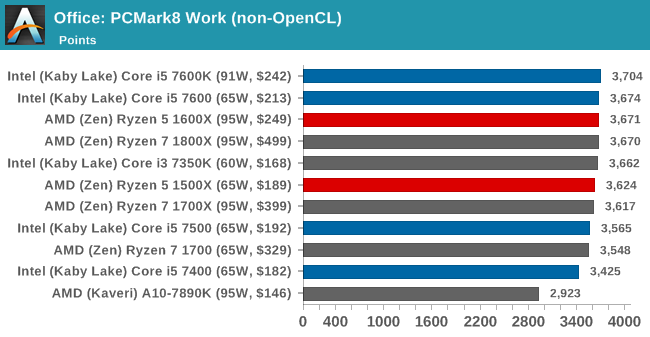
Despite originally coming out in 2008/2009, Futuremark has maintained PCMark8 to remain relevant in 2017. On the scale of complicated tasks, PCMark focuses more on the low-to-mid range of professional workloads, making it a good indicator for what people consider 'office' work. We run the benchmark from the commandline in 'conventional' mode, meaning C++ over OpenCL, to remove the graphics card from the equation and focus purely on the CPU. PCMark8 offers Home, Work and Creative workloads, with some software tests shared and others unique to each benchmark set.
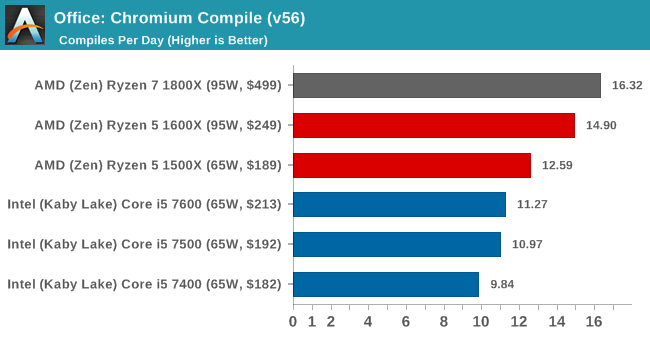
Chromium Compile (v56)
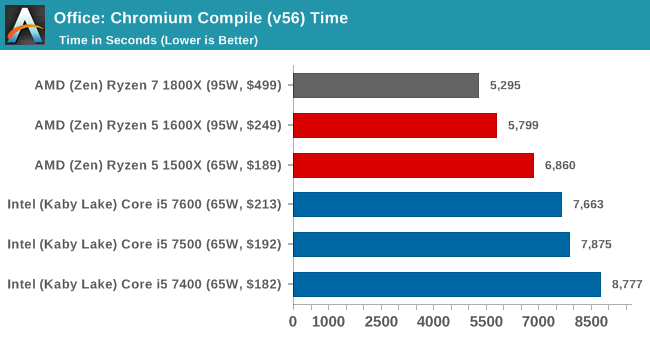
Our new compilation test uses Windows 10 Pro, VS Community 2015.3 with the Win10 SDK to combile a nightly build of Chromium. We've fixed the test for a build in late March 2017, and we run a fresh full compile in our test. Compilation is the typical example given of a variable threaded workload - some of the compile and linking is linear, whereas other parts are multithreaded.
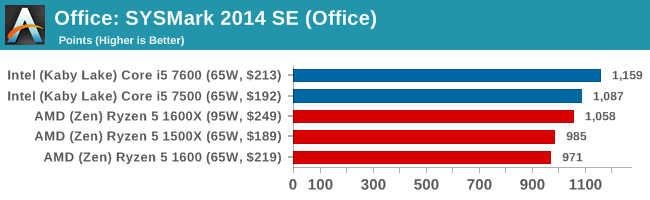
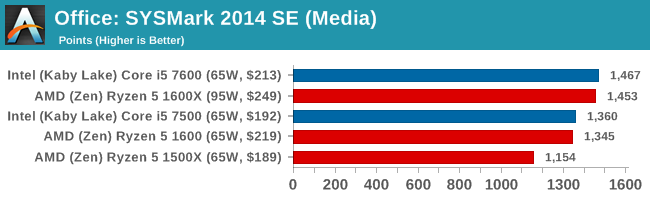
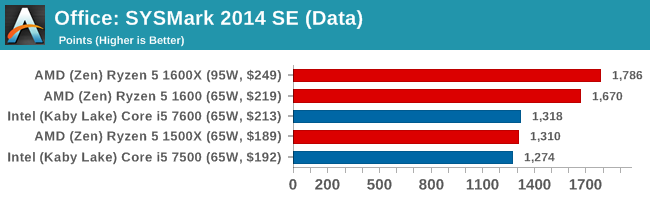
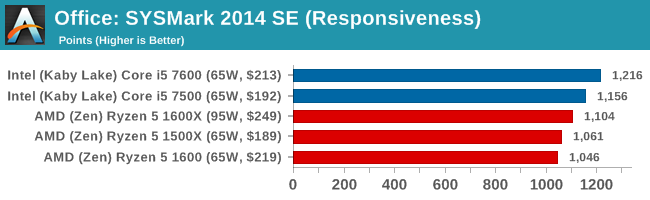
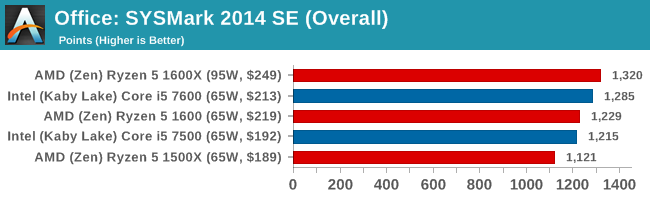
SYSmark 2014 SE
SYSmark is developed by Bapco, a consortium of industry CPU companies. The goal of SYSmark is to take stripped down versions of popular software, such as Photoshop and Onenote, and measure how long it takes to process certain tasks within that software. The end result is a score for each of the three segments (Office, Media, Data) as well as an overall score. Here a reference system (Core i3-6100, 4GB DDR3, 256GB SSD, Integrated HD 530 graphics) is used to provide a baseline score of 1000 in each test.
A note on contect for these numbers. AMD left Bapco in the last two years, due to differences of opinion on how the benchmarking suites were chosen and AMD believed the tests are angled towards Intel processors and had optimizations to show bigger differences than what AMD felt was present. The following benchmarks are provided as data, but the conflict of opinion between the two companies on the validity of the benchmark is provided as context for the following numbers.


254 Comments
View All Comments
hojnikb - Tuesday, April 11, 2017 - link
Any word on R5 1400 review ? Would be interesting to see how 1/2 of L3 cache hits performance.Ian Cutress - Tuesday, April 11, 2017 - link
We've been promised a sample to arrive soon. I'm off some of next week, so after then :)Omega215D - Tuesday, April 11, 2017 - link
Just steal it from LinusTechTips... You know he has that stuff just lyin' around after fumbling with it =)msroadkill612 - Thursday, April 13, 2017 - link
No, but we have evidence of the effect of double l3 on ryzen cores - if that helps.current 4 core ryzens have double the l3 per core as 8 core ryzens do.
Infy2 - Tuesday, April 11, 2017 - link
Shame 7700K is not among the results so we can't compare Ryzen 4C/8T to the best of Intel's 4C/8T.ddriver - Tuesday, April 11, 2017 - link
Slightly better in games, marginally behind in intensive computations.Ian Cutress - Tuesday, April 11, 2017 - link
For CPU tests, it's in our Benchmark database: www.anandtech.com/benchI still need to run our gaming tests on a whole raft of CPUs, something to do the rest of this month!
0ldman79 - Tuesday, April 11, 2017 - link
Any chance the formatting could be corrected to the FX line can be directly compared to the Ryzen line?Some of the benchmarks overlap but the formatting is different. A direct comparison isn't possible now in a single window. We have to open two windows to compare.
Ian Cutress - Friday, April 14, 2017 - link
All the old data was on Windows 7, the new data is Windows 10. I've made it so in the same window the scores are comparable on the same OS.milli - Tuesday, April 11, 2017 - link
Something really weird is going on with the Rise of the Tomb Raider and Ryzen. There's a huge drop in performance in DX12 for Ryzen+nVidia.I mean, how on earth can the A10-7890K be faster than the 1500X? That game or nVidia's drivers need updating.