The NVIDIA GeForce GTX 1080 Ti Founder's Edition Review: Bigger Pascal for Better Performance
by Ryan Smith on March 9, 2017 9:00 AM ESTPower, Temperature, & Noise
As always, last but not least is our look at power, temperature, and noise. Next to price and performance of course, these are some of the most important aspects of a GPU, due in large part to the impact of noise. All things considered, a loud card is undesirable unless there’s a sufficiently good reason – or sufficiently good performance – to ignore the noise.
| GeForce Video Card Voltages | |||||
| GTX 1080 Ti Boost | GTX 1080 Boost | GTX 980 Ti Boost | GTX 1080 Ti Idle | ||
| 1.062v | 1.062v | 1.187v | 0.65v | ||
Starting with voltages, there aren’t any big surprises with the GTX 1080 Ti. The underlying GP102 GPU has the same load voltages as the GP104 GPU in the GTX 1080, resulting in a load voltage of 1.062v.
Moving on, let’s take a look at average clockspeeds. The GTX 1080 Ti’s official base and boost clockspeeds are lower than the GTX 1080’s, but as we’ve seen before with other NVIDIA video cards, the actual clockspeeds are a little more variable and almost always higher than NVIDIA’s official values. Consequently the GTX 1080 Ti’s clockspeeds may on average trail the GTX 1080 less than what the specifications say.
| GeForce Video Card Average Clockspeeds | |||
| Game | GTX 1080 Ti | GTX 1080 | |
| Max Boost Clock |
1898MHz
|
1898MHz
|
|
| Tomb Raider |
1620MHz
|
1721MHz
|
|
| DiRT Rally |
1721MHz
|
1771MHz
|
|
| Ashes |
1680MHz
|
1759MHz
|
|
| Battlefield 4 |
1657MHz
|
1771MHz
|
|
| Crysis 3 |
1632MHz
|
1759MHz
|
|
| The Witcher 3 |
1645MHz
|
1759MHz
|
|
| The Division |
1645MHz
|
1721MHz
|
|
| Grand Theft Auto V |
1746MHz
|
1797MHz
|
|
| Hitman |
1657MHz
|
1771MHz
|
|
On the whole, the GTX 1080 Ti does average lower clockspeeds than the GTX 1080. Whereas the latter would frequently average clockspeeds in the 1700MHz range, the GTX 1080 Ti averages clockspeeds in the 1600MHz range. This, in part, is why NVIDIA is promoting the GTX 1080 Ti as being 35% faster than the GTX 1080, despite the card having a 40% advantage in total hardware units.
It is interesting to note though that our GTX 1080 Ti sample has the same maximum boost clock as the GTX 1080: 1898MHz. If the GTX 1080 Ti didn’t hit its thermal limit as often, it likely would come even closer to the GTX 1080 in average clockspeeds.
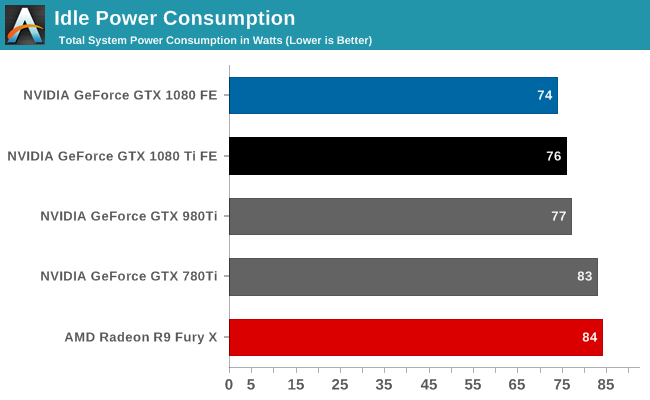
Moving on to power consumption, we’ll start as always with idle power. All told, there are no surprises here. GTX 1080 Ti’s idle power consumption is right next to GTX 980 Ti, which is where we’d expect it given the 250W design.
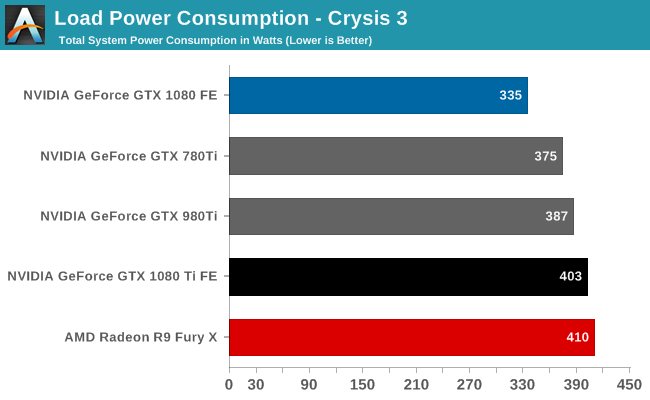
System power consumption under Crysis 3 is also right where we’d expect it to be for the GTX 1080 Ti. In absolute terms it’s second only to the R9 Fury X – which is to say that it’s high – but as Crysis 3 is a real-world test, power numbers here are influenced by the rest of the system. The faster the card, the more work required of the CPU, RAM, etc, and that’s exactly what’s happening here.
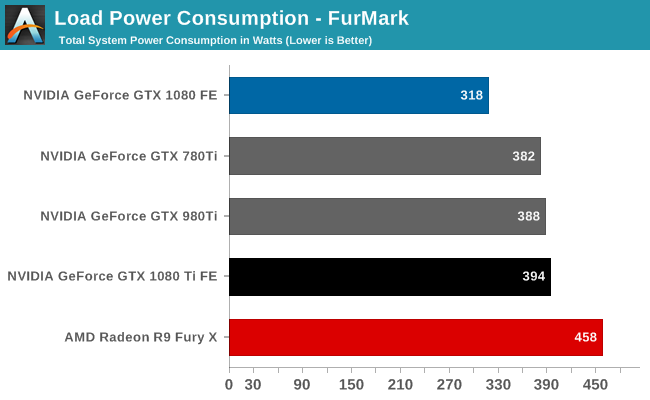
Switching over to FurMark, which is a much more GPU-focused test, we find that our GTX 1080 Ti-equipped testbed draws 394W at the wall. This is a smidge higher than the GTX 980 Ti, but not meaningfully so. All 3 250W NVIDIA cards are closely clustered together, showing that NVIDIA’s power throttling is working as expected, and at the levels expected. GTX 1080 Ti is rated for 70W higher than the GTX 1080, and our results back this rating up. With NVIDIA’s well-established power/performance tiers, GTX 1080 Ti makes the expected leap in power consumption in order to reach its loftier performance target.
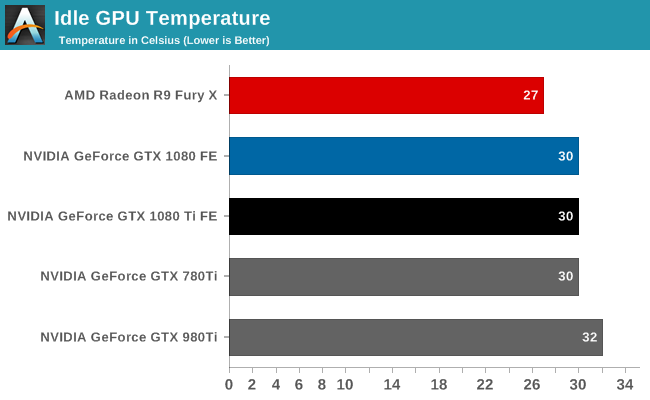
Moving on to temperatures, at idle the GTX 1080 Ti settles at 30C, the same as its siblings.
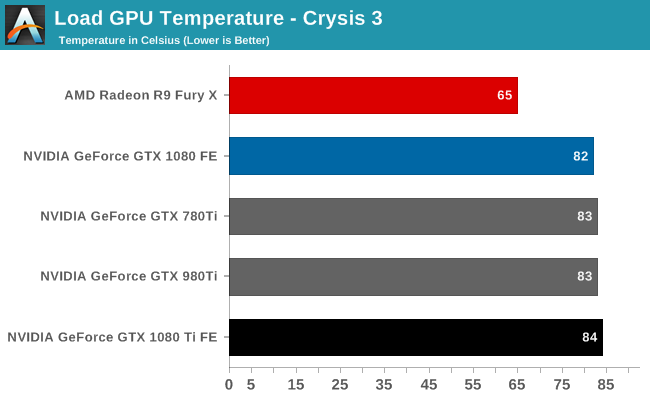
As for Crysis 3, the GTX 1080 Ti ends up being the hottest card here despite the cooling improvements, though it should be noted that this is intentional. While NVIDIA doesn’t publish this information directly, the GTX 1080 Ti’s preset thermal throttle point is 84C, which is a degree or two higher than on NVIDIA’s previous cards. As a result, the card reaches equilibrium at a slightly higher temperature than NVIDIA’s other cards.
It’s interesting to note that the throttle point has been slowly creeping up over the years; going back to the original Titan, it was only 80C. As far as reference specification designs go, the higher temperatures improve the efficiency of the cooler. The downside to higher temperatures is that power leakage increases with the temperature. So there’s a careful balancing act here in getting better cooling performance without drowning it out in more leakage-induced heat. In the case of the GTX 1080 Ti, I suspect NVIDIA paid their dues here with the additional MOSFETs, giving them a bit more headroom for leakage.
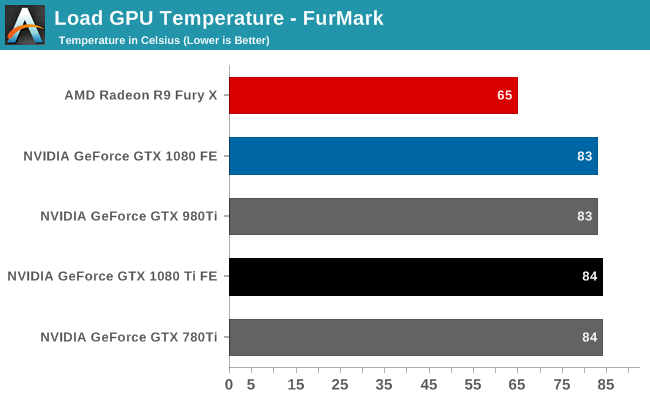
The story is much the same under FurMark. The GTX 1080 Ti settles at 84C here as well – though it did peak at 86C before reaching equilibrium – showcasing that regardless of the workload, the card always levels out at its thermal throttling point.
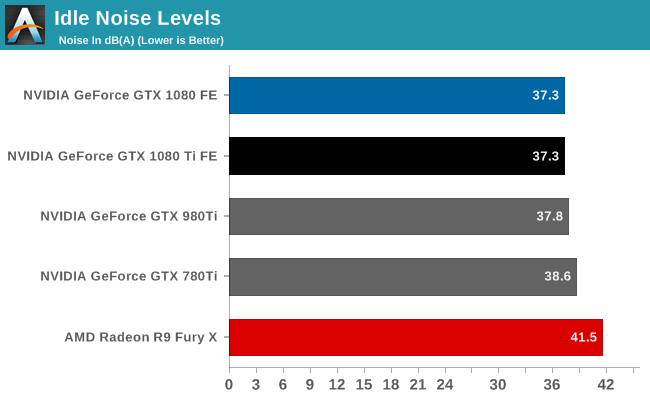
Finally we have our look at noise, starting with idle noise. Relative to the GTX 1080 NVIDIA has tweaked the fan curve a bit here, but at idle the GTX 1080 Ti is already below our noise floor.
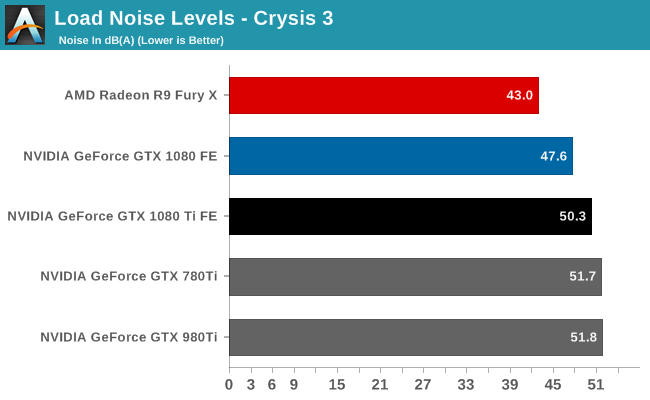
Moving over to Crysis 3, we find that the GTX 1080 Ti holds a small edge over our other 250W TI-series cards. NVIDIA’s latest card hits 50.3dB, about 1.5dB below the GTX 980 Ti and GTX 780 Ti. This won’t make much of a difference, but it does close the gap between the 250W cards and the GTX 1080 by a bit.
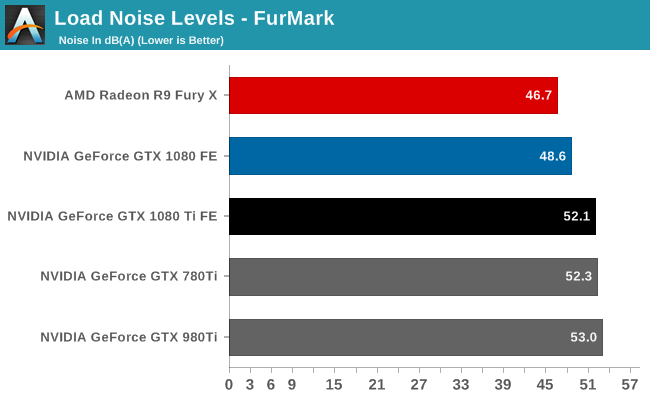
Finally, the situation with FurMark is much the same. The GTX 1080 Ti is still ever so slightly quieter than the other 250W NVIDIA cards, but a few dB louder than the GTX 1080.
Overall, judging from the power and noise characteristics of the GTX 1080 Ti, along with its throttling practices, it looks like NVIDIA invested most of their gains with the improved cooling system in removing more heat from the card itself. With few exceptions, the GTX 1080 Ti thermal throttles before it TDP throttles, and anecdotally, it tends to be closer to its TDP limit than most of the other high-end NVIDIA cards we’ve seen in the past couple of years.
Going back to what NVIDIA said earlier, they are claiming that the GTX 1080 Ti offers the largest performance uplift over its non-TI counterpart. Given that the TDP gap between the GTX 1080 Ti and GTX 1080 is actually smaller than the gap between the GTX 980 Ti and GTX 980 Ti – 70W versus 85W – if anything we’d expect this to be smaller. But by investing their gain from the improved cooler in better heat removal, NVIDIA is actually getting the GTX 1080 Ti closer to its performance/TDP limit than the previous generations of Ti cards. The only downside here is that you can only remove the DVI port once, so this isn’t an act that NVIDIA will be able to repeat in the next generation.


161 Comments
View All Comments
SaolDan - Thursday, March 9, 2017 - link
i dont need it but i really want it. currently gaming and vr on a 1070 and loving it.Endda - Thursday, March 9, 2017 - link
Would have loved to see the Titan XP in those graphsRyan Smith - Thursday, March 9, 2017 - link
Unfortunately NVIDIA never sampled us on that one, so I don't have one on-hand to test again.Samus - Thursday, March 9, 2017 - link
Can't wait to pickup one of these in a year for ~$400. Easily future-proof for the next generation of console games, and my 780Ti is really showing its age, by about 154%...Nfarce - Friday, March 10, 2017 - link
If you think you are going to see a 1080Ti in 12 months selling for $400, I've got a like-new Ferrari to selling you for $15k. It will be nearly summer before the AIB GPUs (ASUS, EVGA, Gigabyte, MSI, etc.) start becoming available in decent supply.rtho782 - Thursday, March 9, 2017 - link
I know I'm an outlier, but having lived with SLI 980s for a couple of years I'm looking to go back to a single card, and I really wish I could find SLI 980 to 1080ti benchmarks :PDrumsticks - Thursday, March 9, 2017 - link
I think the original AT review of the 1080 compares them. Go there and just tack on another 30% maybe?mapesdhs - Saturday, March 11, 2017 - link
If it's of any help, I've done a fair few 980 SLI tests for 3DMark, Unigine, etc., you could compare those to 1080 Ti reviews (several sites have included 3DMark results, and Techpowerup has a couple of Unigine results threads/tables); PM me for links, or email (Google "Ian SGI", find the Contact page, use my Yahoo address).Achaios - Thursday, March 9, 2017 - link
It should be borne in mind that Benchmark results are misleading, especially when referring to the 780TI.The 780TI launched at ridiculously low clocks of 875MHz Core Clock and 928 MHz Boost Clock, which wasn't much different from what a GTX 580 OC'd could do.
When overclocked, the 780TI worked at around 1.25 GHz, a huge difference over the stock card.
So, while the 1080TI has got more than double the performance of an OC'd 780TI as per 3D Mark Firestrike, the performance shown herein for the 780TI is ridiculously low and thus, misleading.
Yojimbo - Thursday, March 9, 2017 - link
I guess if you're worried about someone making judgments of general GPU trends without fully researching it, that's true. But owners of 780 Ti cards should be aware of where their individual cards sit compared to the reference design. In any case it's always going to be hairy taking overclocking performance into account when making judgments about generational trends. For instance, 2017 1060s and 1080s are going to be able to overclock better than 2016 1060s and 1080s. There's also a whole range of clock speeds that come out. Do you take the fastest or the average? If you take the average do you take the average of the SKUs or an average weighted by units sold? It's not so easy to get an accurate picture without a lot of work.