The Samsung 850 EVO 4TB SSD Review
by Billy Tallis on July 11, 2016 10:00 AM ESTMixed Random Read/Write Performance
The mixed random I/O benchmark starts with a pure read test and gradually increases the proportion of writes, finishing with pure writes. The queue depth is 3 for the entire test and each subtest lasts for 3 minutes, for a total test duration of 18 minutes. As with the pure random write test, this test is restricted to a 16GB span of the drive, which is empty save for the 16GB test file.
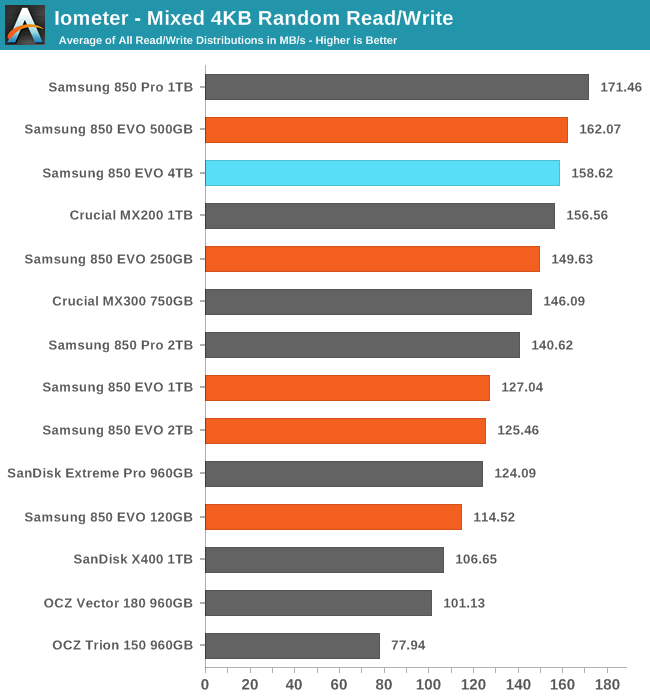
The mixed random I/O performance of the 4TB 850 EVO is much better than the other large 850 EVOs, putting te 4TB model close to the top of the chart.
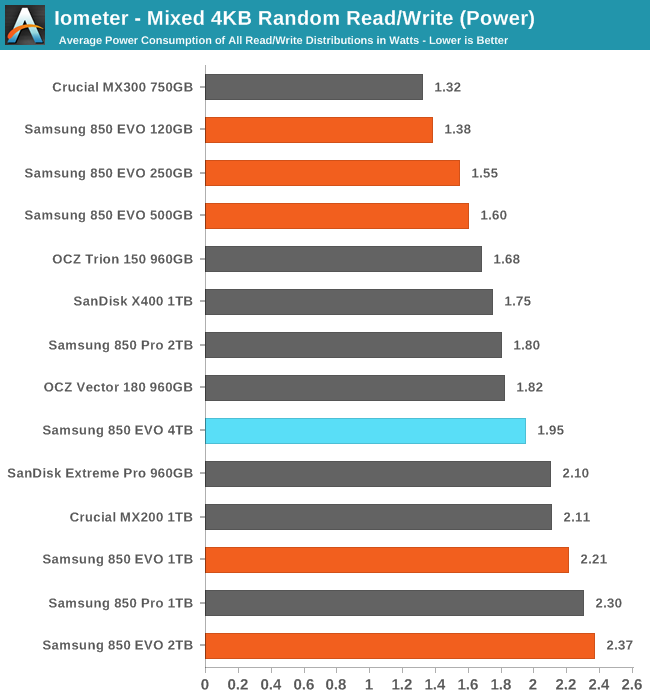
The 4TB 850 EVO also manages a large reduction in power usage as compared with the 1TB and 2TB 850 EVOs, making the 4TB much more efficient.
 |
|||||||||
Unlike the other 850 EVOs, the 4TB never loses performance as the proportion of writes in the test workload increases. Meanwhile, the power draw is essentially constant until near the end of the test.
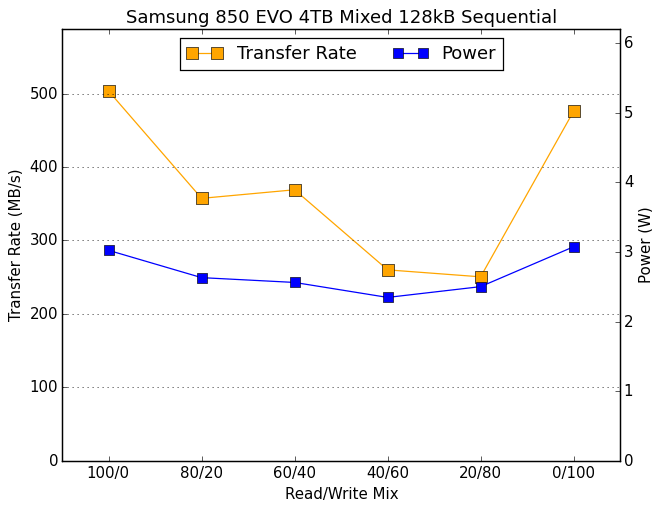
Mixed Sequential Read/Write Performance
The mixed sequential access test covers the entire span of the drive and uses a queue depth of one. It starts with a pure read test and gradually increases the proportion of writes, finishing with pure writes. Each subtest lasts for 3 minutes, for a total test duration of 18 minutes. The drive is filled before the test starts.
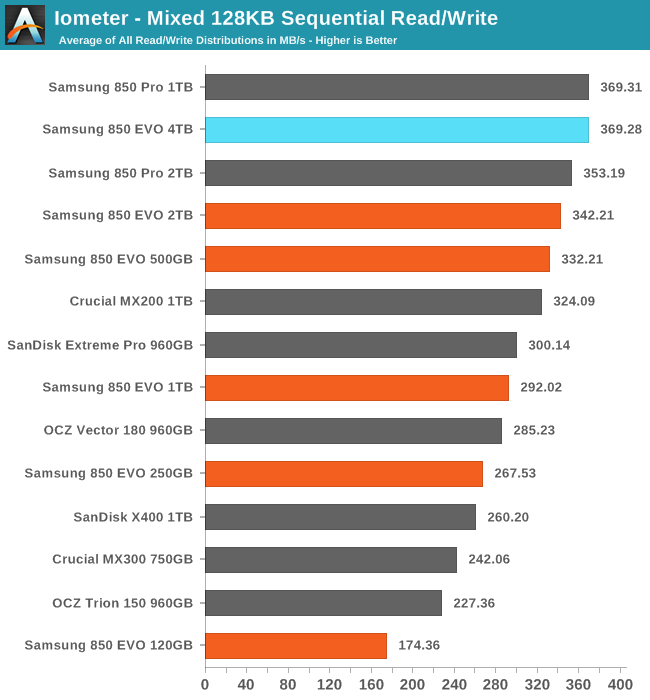
The 4TB 850 EVO is essentially tied for the best mixed sequential read and write performance.
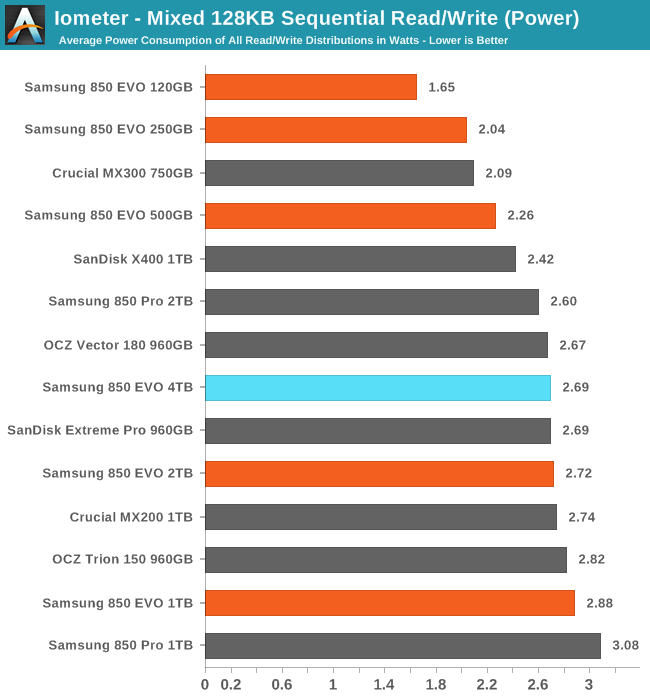
The 4TB 850 EVO averages using slightly less power than the 2TB model, and it is one of the most efficient of the large drives.
 |
|||||||||
The usual pattern is for performance on this test to resemble a bathtub curve, but the 2TB 850s and the 4TB 850 EVO don't lose as much of their performance during the first half of the test, leading them to bottom out much later than most other drives.


145 Comments
View All Comments
ACE76 - Monday, July 11, 2016 - link
http://www.fudzilla.com/news/memory/39668-mushkin-...Wait for this....any company that releases something first, price gouges.
JellyRoll - Monday, July 11, 2016 - link
The "21nm" is the BL half pitch. The EE Times article does not say that they shrunk from 40 to 21 for the overall measurement.Billy Tallis - Monday, July 11, 2016 - link
Yep, I misinterpreted that. They haven't changed the lithography, but they've shrunk some parts of the die through other means.amayii - Monday, July 11, 2016 - link
Why wasn't the Samsung 950pro taken into account in the benchmark?Is is because it is a NVMe SSD?Solidstate89 - Monday, July 11, 2016 - link
Of course that's the reason. We all know a PCI-e/M.2 SSD (whether it uses NVMe or not) will blow the pants off any SATA SSD when it comes to performance numbers.There is no reason to compare them.
amayii - Monday, July 11, 2016 - link
Ok, thanks!Samus - Monday, July 11, 2016 - link
This drive cost more than my whole PC :/Notmyusualid - Tuesday, July 12, 2016 - link
Ha ha, thanks for putting it into perspective!Made me smile.
doggface - Monday, July 11, 2016 - link
I would hope that when a manufacturer moves to a new process there would be a corresponding drop in $/GB. To be moving to 48layer and still charging ~30c is worrying. Needs to be a third of that to be anything other than a wet dream for consumer.The theorised ssd takeover of HDDs doesnt seem to be materialising yet.
Kristian Vättö - Monday, July 11, 2016 - link
A new process doesn't mean immediate cost savings. It takes time for yields to mature and even then 48L has more process steps than 32L. Ultimately it's a game of economics. Why would you sell something for 10c when the competition is charging 30c? For companies it's always all about the profit.