The Intel Skull Canyon NUC6i7KYK mini-PC Review
by Ganesh T S on May 23, 2016 8:00 AM ESTPerformance Metrics - II
In this section, we mainly look at benchmark modes in programs used on a day-to-day basis, i.e, application performance and not synthetic workloads.
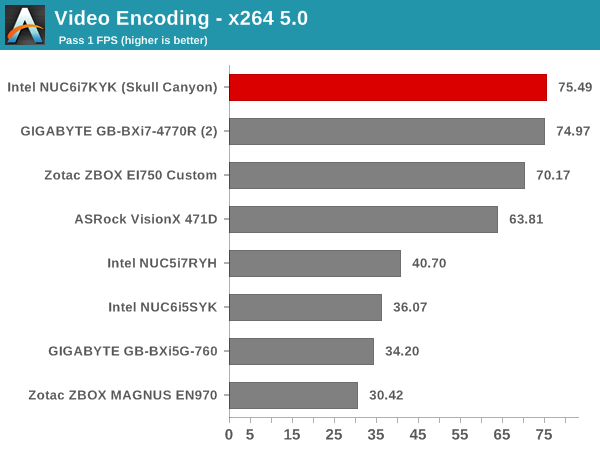
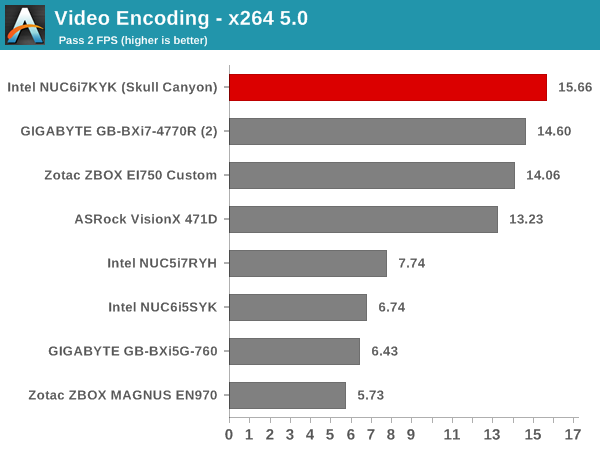
x264 Benchmark
First off, we have some video encoding benchmarks courtesy of x264 HD Benchmark v5.0. This is simply a test of CPU performance. As expected, the latest generation 45W Core i7-6770HQ emerges as the best of the lot, surpassing even 65W TDP CPUs from a couple of generations back.
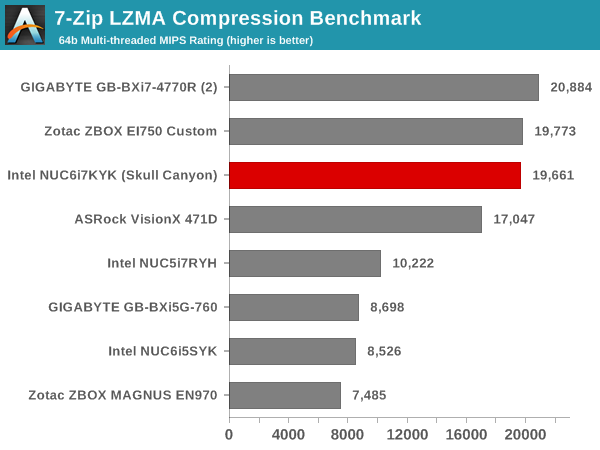
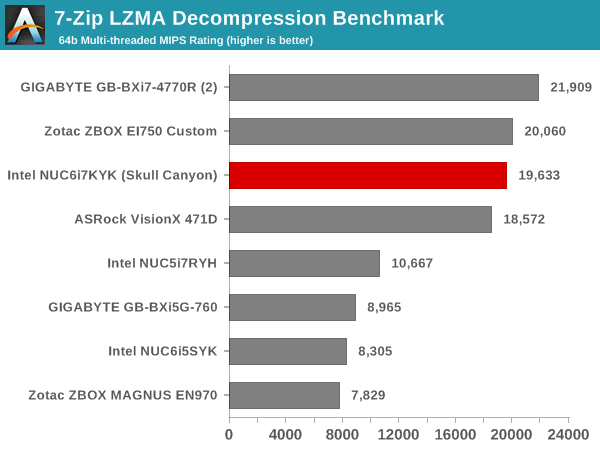
7-Zip
7-Zip is a very effective and efficient compression program, often beating out OpenCL accelerated commercial programs in benchmarks even while using just the CPU power. 7-Zip has a benchmarking program that provides tons of details regarding the underlying CPU's efficiency. In this subsection, we are interested in the compression and decompression MIPS ratings when utilizing all the available threads. This workload doesn't show the benefits evident in the previous section, with systems using the 65W TDP CPUs getting a slight lead over the NUC6i7KYK.
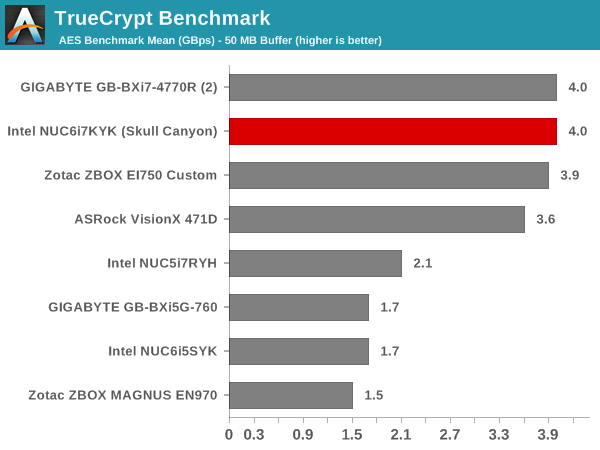
TrueCrypt
As businesses (and even home consumers) become more security conscious, the importance of encryption can't be overstated. Intel CPUs supporting the AES-NI instruction have acceleration for the encryption and decryption processes. The Core i7-6770HQ in the NUC6i7KYK does have AES-NI support. TrueCrypt, a popular open-source disk encryption program can take advantage of the AES-NI capabilities. The TrueCrypt internal benchmark provides some interesting cryptography-related numbers. In the graph below, we can get an idea of how fast a TrueCrypt volume would behave in the Intel NUC6i7KYK (Skull Canyon) and how it would compare with other select PCs. This is a purely CPU feature / clock speed based test.
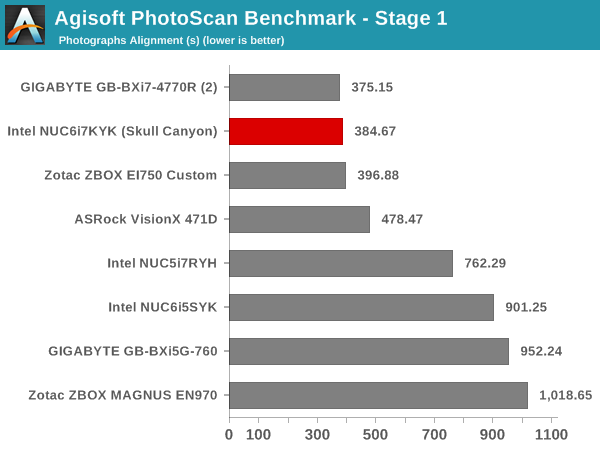
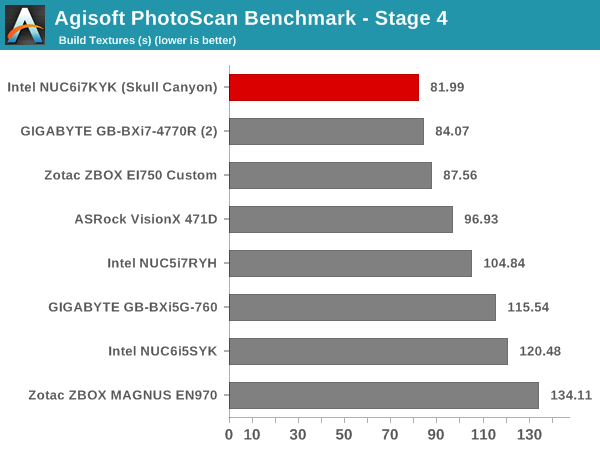
Agisoft Photoscan
Agisoft PhotoScan is a commercial program that converts 2D images into 3D point maps, meshes and textures. The program designers sent us a command line version in order to evaluate the efficiency of various systems that go under our review scanner. The command line version has two benchmark modes, one using the CPU and the other using both the CPU and GPU (via OpenCL). The benchmark takes around 50 photographs and does four stages of computation:
- Stage 1: Align Photographs
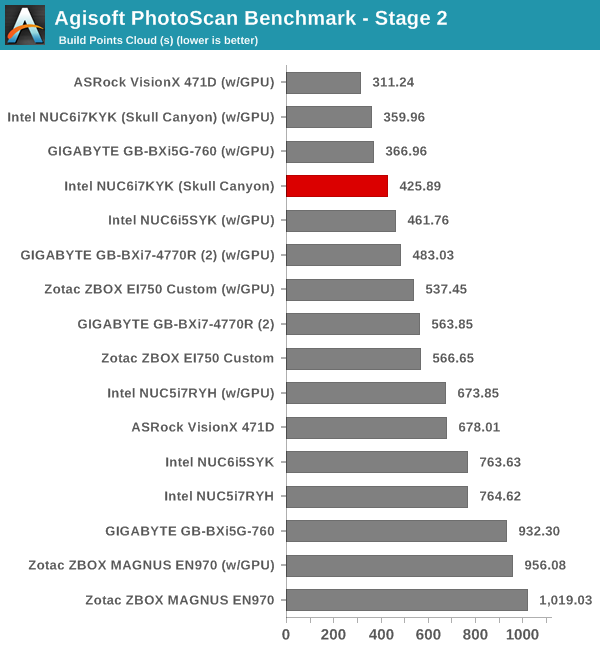
- Stage 2: Build Point Cloud (capable of OpenCL acceleration)
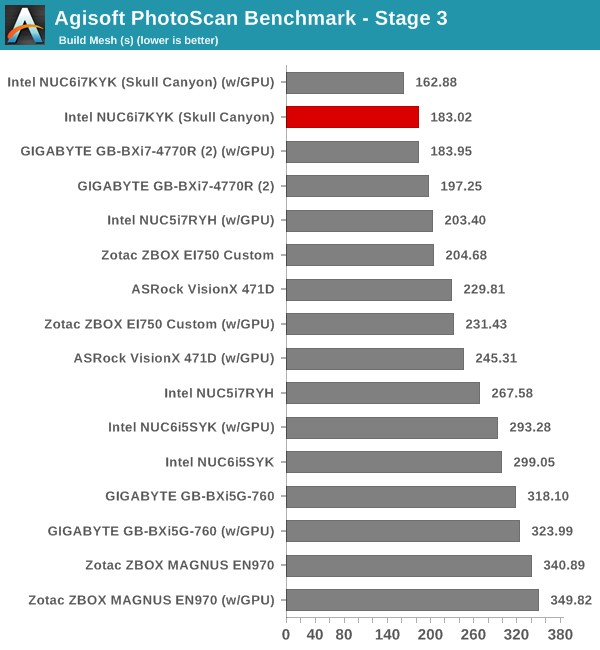
- Stage 3: Build Mesh
- Stage 4: Build Textures
We record the time taken for each stage. Since various elements of the software are single threaded, others multithreaded, and some use GPUs, it is interesting to record the effects of CPU generations, speeds, number of cores, DRAM parameters and the GPU using this software.
The combination of CPU power and EDRAM helps the compute capabilities when it comes to OpenCL acceleration in the second stage of the benchmark. Only the ASRock VisionX 471D with an AMD GPU performs better. Skull Canyon is placed in the top two in all the CPU-intensive stages.
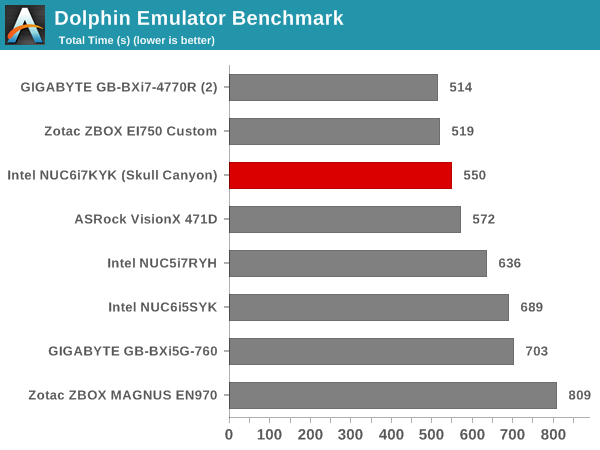
Dolphin Emulator
Wrapping up our application benchmark numbers is the Dolphin Emulator benchmark mode results. This is again a test of the CPU capabilities, and this workload favors the 65W TDP CPUs. The architectural changes in Skylake are not enough to overcome the benefits provided by the higher-clock speed of the Core i7-4770R.


133 Comments
View All Comments
fanofanand - Monday, May 23, 2016 - link
You rebutted your own statement. Casual gamers don't buy $1k mini-PC's. Testing this at super low resolutions can only serve one purpose, which is to provide the appearance of acceptable performance.ganeshts - Monday, May 23, 2016 - link
The point with mini-PC reviews with a gaming focus is that they are spread far apart - we may be lucky to have 3 or 4 in a year.So, it boils down to what we think is more relevant to the reader - a set of benchmark numbers that have to be presented standalone, or a set of benchmark numbers which can be compared apples to apples against some similar previous-generation systems (because, that is what we have the numbers for). We think the latter makes more sense, and that is the reason we are having these 'legacy resolutions' in the gaming benchmarks.
fanofanand - Monday, May 23, 2016 - link
I completely understand why you need to present the information, I just don't think this really meets the "Skulltrail brand" expectations. Skulltrail was always an enthusiast platform designed by enthusiasts. This product looks like it fell victim to marketing requiring a certain thickness of chassis. This product waters down the skulltrail branding, though I guess skulltrail really isn't even relevant anymore. I just don't understand who this is designed for I guess.FMinus - Sunday, August 7, 2016 - link
this really isn't a low budget part, they can get similar or better performance in an ATX form factor for around ~$100 to 200 less.zepi - Monday, May 23, 2016 - link
I'd love to see a ~90W TDP version of this with CPU cores getting about 30W and GPU having 60 or so allocated for it. Even 65W TDP part would be a definite improvement for gaming as CPU / GPU clocks could stay considerably higher during loading of both parts of the chip.With proper cooling it could actually compete decently with low-end discrete graphic laptops. Now it is clear that TDP is limiting it badly.
The question is: How is the perf/w compared to for example A9x GPU parts or Maxwells? Somehow I'm not terribly impressed by Intel's GPU's. Especially considering that they've had their hugely superior manufacturing technology which should help...
Osamede - Monday, May 23, 2016 - link
Power consumption measured with a 1080p display. Is this the real use case?ganeshts - Monday, May 23, 2016 - link
Why not? Not everyone has migrated to 4K yet. I am a first-world tech reviewer, and the max. res monitor that I have is only 2560x1440 :)jhoff80 - Monday, May 23, 2016 - link
Out of curiosity, will there also be an Anandtech review of the new Core M Compute Sticks as well?jaydee - Monday, May 23, 2016 - link
Isn't is kinda a no-brainer to make this thing a little big bigger (with a little better cooling), to avoid throttling? Wouldn't just an inch taller help immensely?ShieTar - Monday, May 23, 2016 - link
Sure, but at ~55mm height it is beginning to look similar in size to a 70 mm high Mini-ITX case, which you can use to build yourself a system with similar compute power, for less than half the system cost.So it really needs to be very flat and very compact to qualify as a niche-product. Asking twice the price for just a 20% difference in some aspect is usually very hard to sell.