The Intel Skull Canyon NUC6i7KYK mini-PC Review
by Ganesh T S on May 23, 2016 8:00 AM ESTPerformance Metrics - I
The Intel NUC6i7KYK (Skull Canyon) was evaluated using our standard test suite for low power desktops / industrial PCs. Not all benchmarks were processed on all the machines due to updates in our testing procedures. Therefore, the list of PCs in each graph might not be the same. In the first section, we will be looking at SYSmark 2014, as well as some of the Futuremark benchmarks.
BAPCo SYSmark 2014
BAPCo's SYSmark 2014 is an application-based benchmark that uses real-world applications to replay usage patterns of business users in the areas of office productivity, media creation and data/financial analysis. Scores are meant to be compared against a reference desktop (HP ProDesk 600 G1 with a Core i3-4130, 4GB RAM and a 500GB hard drive) that scores 1000 in each of the scenarios. A score of, say, 2000, would imply that the system under test is twice as fast as the reference system.
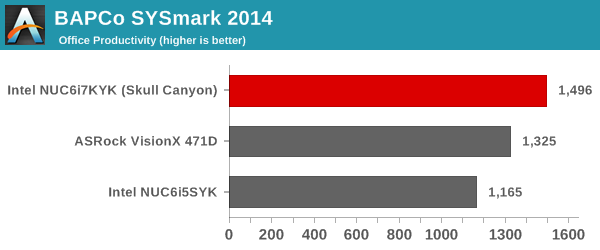
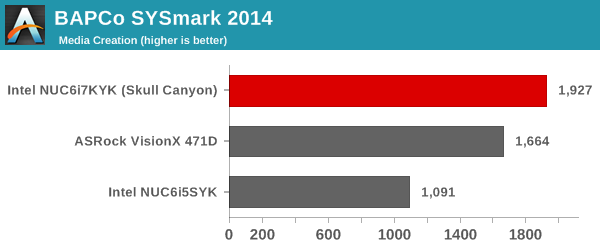
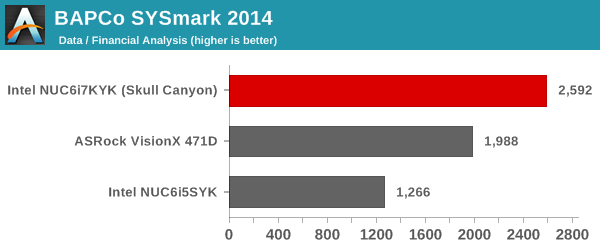

We started using SYSmark 2014 quite recently, which is the main reason for the absence of many of the comparison systems in the above graphs. In any case, the most interesting of the compared lot when it comes to CPU-intensive benchmarks like SYSmark 2014 is the ASRock VisionX 471D, equipped with a Core i7-4712MQ processor. We can see that the Core i7-6770HQ-based Skull Canyon NUC6i7KYK is miles ahead of the other two systems when it comes to office / business workloads. Readers interested in comparing the SYSmark 2014 scores for systems based on other CPUs can peruse the Bench results here.
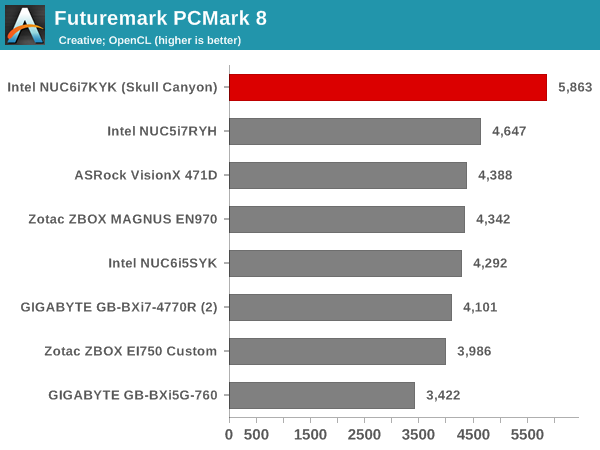
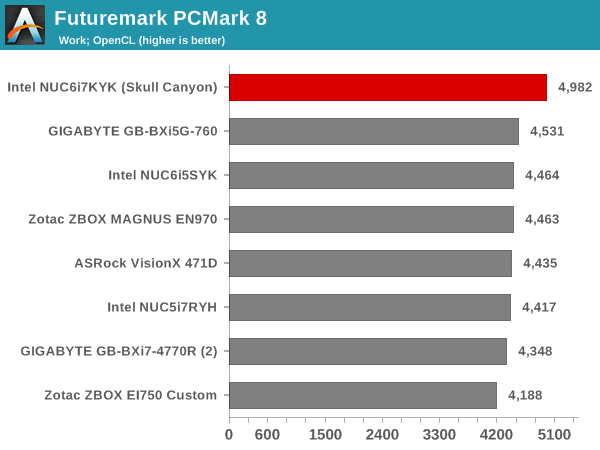
Futuremark PCMark 8
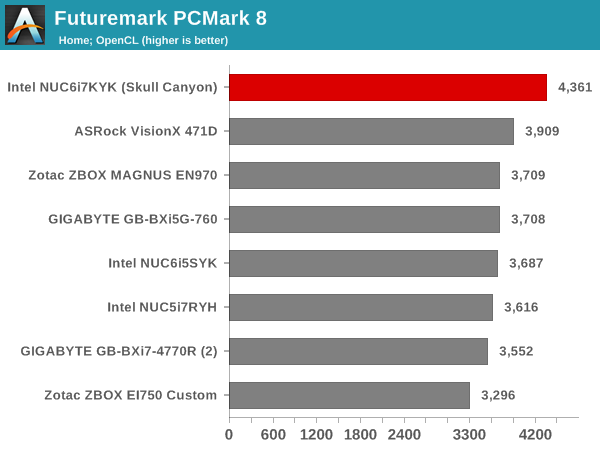
PCMark 8 provides various usage scenarios (home, creative and work) and offers ways to benchmark both baseline (CPU-only) as well as OpenCL accelerated (CPU + GPU) performance. We benchmarked select PCs for the OpenCL accelerated performance in all three usage scenarios. These scores are heavily influenced by the CPU in the system. As expected, the Core i7-6770HQ enables the NUC6i7KYK to easily come out on top in the charts.
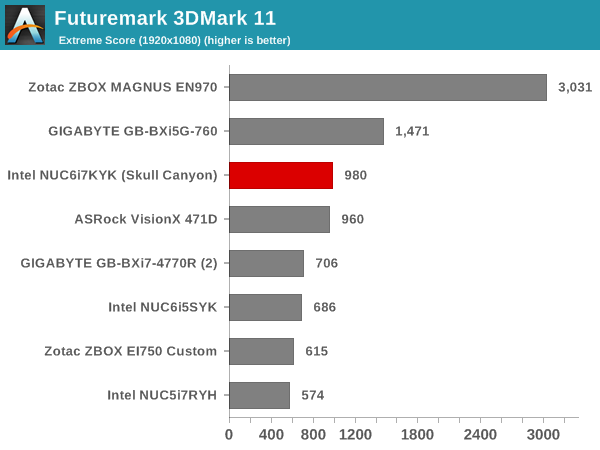
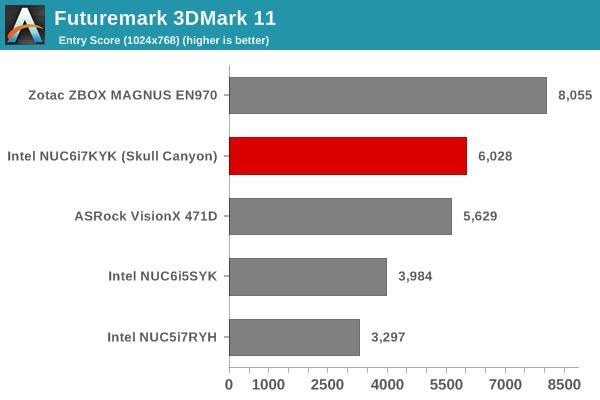
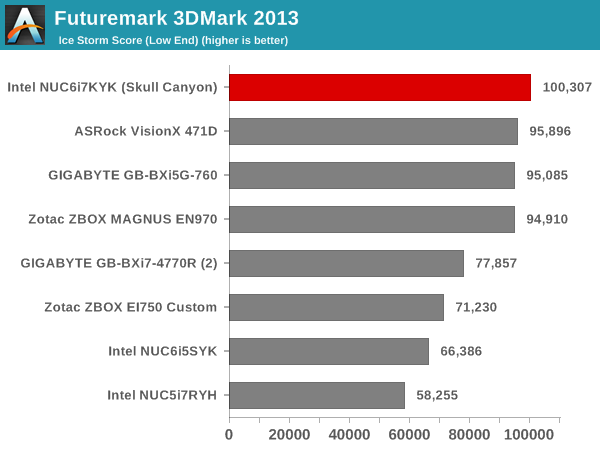
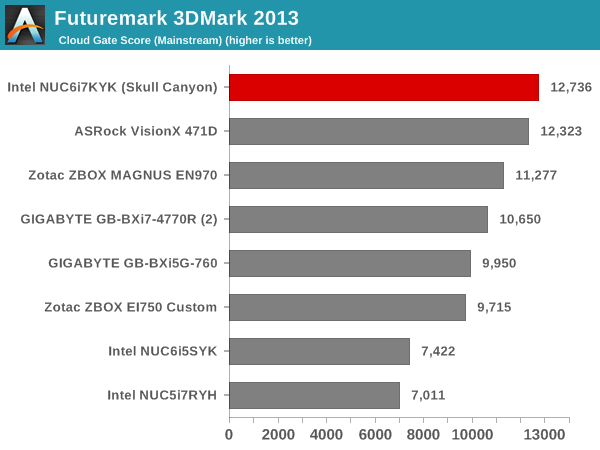
Miscellaneous Futuremark Benchmarks
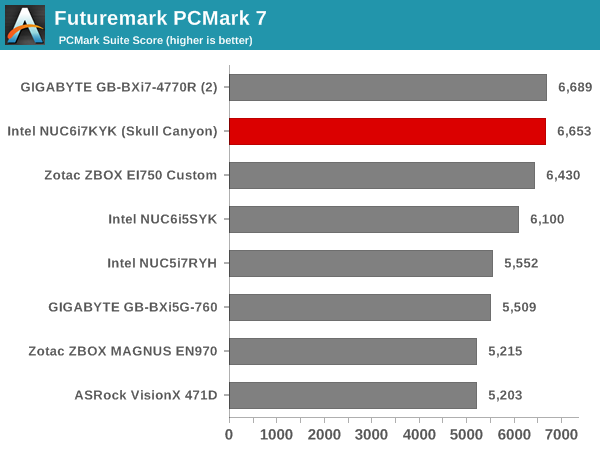
The graphics benchmarks present a different story, though. In these, the NUC6i7KYK does perform well enough to come in the top half. However, in scenarios which are not CPU-bound, the systems equipped with discrete GPUs easily turn out to be better than Skull Canyon.
3D Rendering - CINEBENCH R15
CINEBENCH R15 is a standard benchmark for 3D rendering. It provides three benchmark modes - OpenGL, single threaded and multi-threaded. Evaluation of select PCs in all three modes provided us the following results.
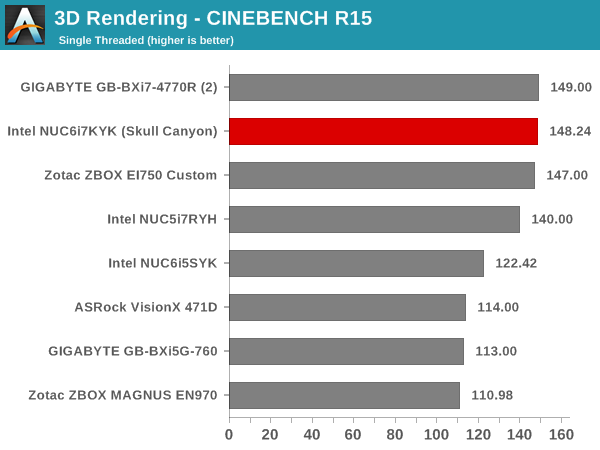
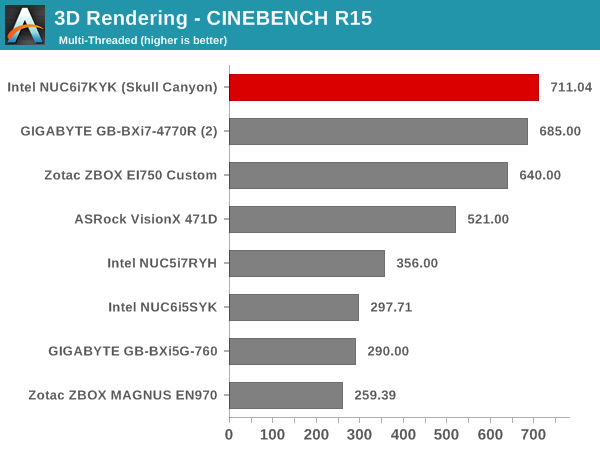
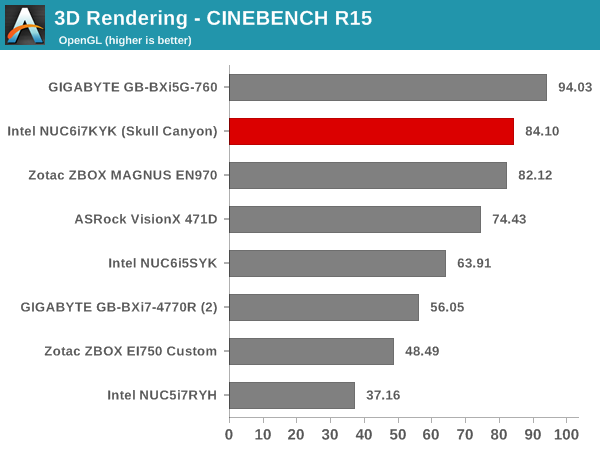
In the single-threaded case, the Core i7-4770R (a 65W TDP CPU which can turbo up to 3.9 GHz) performs slightly better than the Core i7-6770HQ. However, the latter wins out in the multi-threaded cases. In the OpenGL case, the GIGABYTE system with the discrete GPU wins out, showing that a combination of CPU power as well as GPU is needed to perform well in this benchmark.


133 Comments
View All Comments
Zero Day Virus - Monday, May 23, 2016 - link
Yep, same here! Would like to see how it compares and if it's worth it :)hubick - Monday, May 23, 2016 - link
It would also be interesting to see how the new BRIX like the GB-BSi7T-6500 stack up.Barilla - Monday, May 23, 2016 - link
I think it's time to drop the 1280x1024 gaming benchmarks. Virtually no one is going to play at such resolution, especially not with a 1000$ pc if a 22" 1080p monitor can be bought for a hundred bucks and change.MrSpadge - Monday, May 23, 2016 - link
If your GPU is slow you HAVE to game at such resolutions, no matter what monitor you have.TheinsanegamerN - Monday, May 23, 2016 - link
Then test at 720p. Nobody buys 5:4 monitors anymore.MrSpadge - Tuesday, May 24, 2016 - link
The aspect ratio does not really matter for GPU testing, it's just the number of pixels the GPU has to compute. So performance at 720p will actually be a bit better.cknobman - Monday, May 23, 2016 - link
Its rather lame that Anand would post up these low resolution benchmarks to try and make the iGPU not look like a total joke (which it is, at least at this price point).For $1000 if it can muster a playable framerate at a resolution outside of a decade old standard than this thing is overpriced.
DanNeely - Monday, May 23, 2016 - link
Lots of casual gamers do play at low resolutions because they don't have the budget to stay on the high end GPU treadmill. The real issue is that the days of doing so at 1280x1024 instead of 1366x768 are long past. This was brought up the last time gaming benchmarks were updated here; but is even more of a glaring issue as time goes on.DanNeely - Monday, May 23, 2016 - link
1680x1050 really should be replaced with 1600x900 too. 16:9 monitors have become ubiquitous; testing at narrower aspect ratios doesn't fit real world usage anymore.I could see a case for going wider at the upper end and slotting an ultrawide 3440x1440 test between conventional 2560x1440 and 3840x2180 gaming. Mostly because it looks like the 1080 still falls just short of being able to play at 4k without having to turn settings down in a lot of games; making 1440p ultra widescreen the effective max single card resolution. (An increasingly important consideration with SLI/xFire becoming progressively less relevant due to temporal AA/post processing techniques that play really badly with multi-GPU setups.)
Barilla - Monday, May 23, 2016 - link
Yeah, I guess my point was IF you want to test at low res, then test at a more relevant low res - 1280x720, 1366x768, 1600x900 etc. But my other point would be that those graphs looke like they look now cause low resolution is paired with low settings, mid resolution with mid settings and so on. Many games these days don't really slow down that much at increased resolution, but rather at increased postprocessing effects - shadows, antialiasing, DoF, you name it. Before I had my current gaming PC I used to game on a laptop with GT555M inside, which is probably weaker than this IGP by some margin, and I ran most games in 1080p at acceptable framerates by turnig the details down. In general it yielded better fps AND better looks than running non-native res and mid graphics settings.But maybe it's just me, I like pixels a lot ;)