Far Cry 2 Dissected: Massive Amounts of Performance Data
by Derek Wilson on November 21, 2008 5:30 AM EST- Posted in
- GPUs
Benchmarking Software: an Analysis of Far Cry 2 Settings under AMD and NVIDIA
Before we get started, let's take a look at our test setup:
Platform: ASUS Rampage II Extreme, Core i7-965, 6GB DDR3-1333, Intel SSD
AMD Driver: Final 8.10 hotfix
NVIDIA Driver: 180.44
Our first goal in getting our testing rolling was to find out what to test and to understand the settings in the game better. We spent time playing the game at different quality levels with different hardware like we generally do. But because we wanted to take advantage of the benchmark tool, we decided to collect a bit of data on different settings with one card from AMD and one card from NVIDIA. We look at three different quality levels under two different DX APIs with two different AA settings across five different resolutions. For those keeping count, that's 60 tests per card or 120 tests total for this section.
The result isn't as much like our usual hardware focused tests, as this provides us with more of an analysis of the game itself. We get a better perspective on how the game responds in different situations with different hardware on different platforms without the need to test every piece of hardware out there. Our hope was that this page could help people who are running a particular setup see generally how performance might change if they tweaked one of the variables. Of course, you can't predict specific performance with this, as there isn't enough data for interpolation purposes, but knowing the general trend and what sort of changes make the largest differences can still be useful.
This test is run with our custom timedemo rather than any of the built in benchmarks.
The cards we chose are the highest end NVIDIA and AMD single GPU solutions (the GeForce GTX 280 and the Radeon HD 4870 1GB). While not everyone will have these cards, we were able to test the broadest range of playable data with them. We'll start our analysis with the NVIDIA hardware in DX9 and DX10.
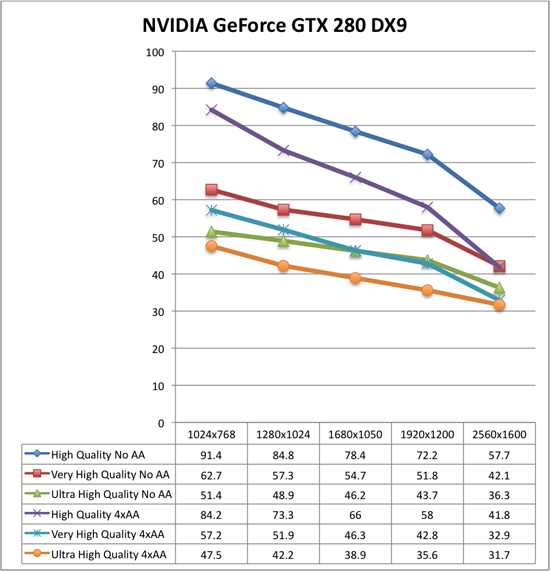
Now take a deep breath because these graphs can be a little tricky. Each graph is only 6 resolution scaling lines, but you'll want to approach them by looking at two groups of three: blue diamonds, red squares, green triangles are no antialiasing, while purple X, blue *, orange circles are 4xAA.
Under DX9 and NVIDIA hardware, High quality performs significantly higher than Very High quality both with and without AA. Moving from Very High quality to High quality gives at best a 47% increase in performance while the worst case is 27% with 4xAA and 37% without. Performance increases in this case generally trend downward as resolution increases. We also see that High quality 4xAA outperforms Very High quality with no AA. While there is a crossover point, Very High quality with 4xAA also performs very similarly to Ultra High quality with no AA.
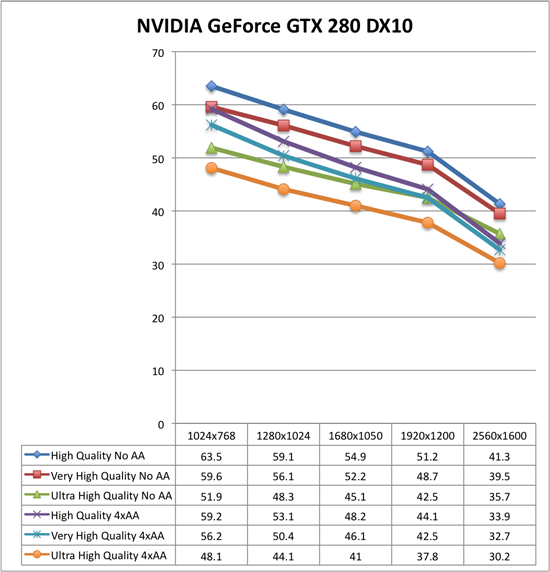
Moving to DX10 under NVIDIA hardware, High quality performance takes a dive while the rest of the numbers stay relatively stable. This basic indication here is that DX9 won't gain you much performance (and will sometimes drop your performance a bit) unless you are looking at High quality mode at which case it could be very worth it to run DX9. As a further consequence, the performance benefit of dropping down to High quality in DX10 mode makes it essentailly useless. High quality with 4xAA looses the advantage over Very High quality with no AA. Very High quality or better is the way to go under DX10, and DX9 should only be paired with High quality mode or lower.
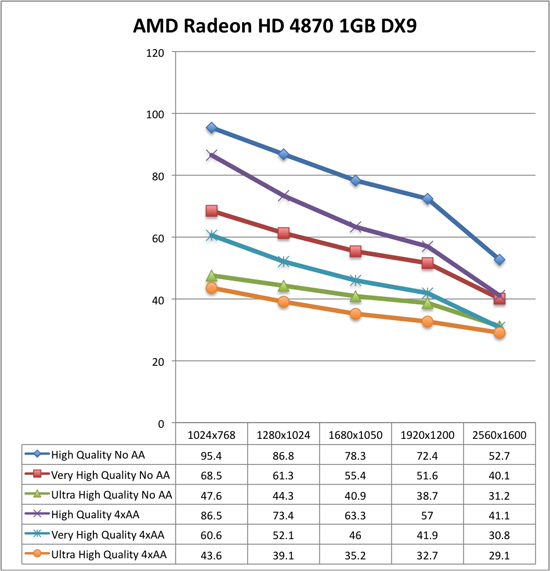
The analysis of the AMD data is very similar to what we see with NVIDIA. We see the same big performance advantage of High quality DX9 with DX10 actually increasing performance at the higher quality levels (the exception is at 2560x1600 where performance drops off more sharply than the GTX 280). The major difference here is in the fact that moving from Ultra High quality to Very High quality gives you a much larger performance increase under AMD than NVIDIA. This means that Very High 4xAA has a larger advantage over Ultra High with no AA (except at 2560x1600), and that it is more worth it to drop back to a lower quality setting to gain performance on AMD hardware. We still recommend Ultra High quality though, unless 4xAA is something you just can't live with out (in that case, Very High quality plus 4xAA is probably the way to go).
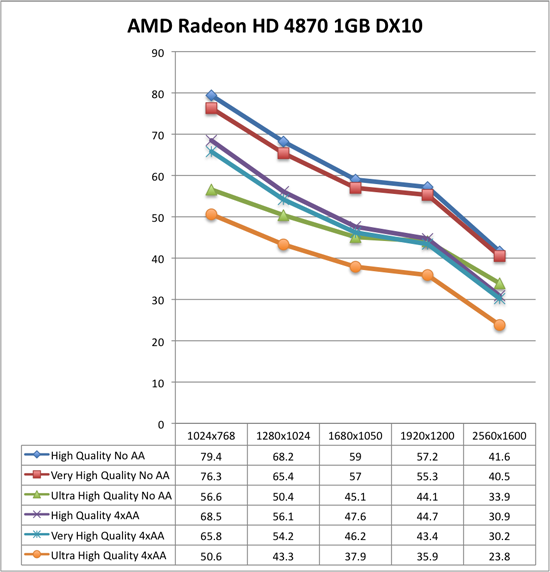
The comparison we haven't made yet is NVIDIA versus AMD. These tests show that under DX10 AMD Radeon HD 4870 1GB is either higher performing than or performing on par with the NVIDIA GeForce GTX 280 (except at ultra high resolutions with 4xAA). This is very impressive due to the $100 price advantage (the GeForce GTX 280 comes in at 33% more expensive than the Radeon HD 4870 1GB at $400). If you've got a 2560x1600 monitor and want to run Ultra High quality with 4xAA, that's the only case where the GeForce GTX 280 is worth it, though you'll be pushing the playability limit there and SLI with two cheaper cards might be a better way to go.
Going forward, we will be looking at DX10 with Ultra High quality settings and will generally favor testing without AA as we feel that Ultra High quality is a better use of resources than 4xAA. For multi-GPU and high end testing, we will still try to include 4xAA numbers though. This custom timedemo will also be the test we stick with rather than the built in RanchSmall demo.


78 Comments
View All Comments
jhh979s - Thursday, November 27, 2008 - link
I'm using a 4850 1GB and I play on ultra high at 1920x1080 with 4 or 8x AA cant remember which. I've never experienced any slowdown but I'm using DX9.gochichi - Tuesday, November 25, 2008 - link
OK, so the 4870 1GB does a much nicer job than the 4870 512MB right? What about the 1GB variants of the 4850?I don't have this game, not sure I really want it for $50.00 (I would buy it at $20.00 for instance). I have a 4850 512MB and am generally amazed by how well it feeds my 1920x1200 monitor.
Let's not forget that Crysis and Far Cry 2 are interesting benchmarks but they are not actually some of the better games out there (going by the reviews).
If you haven't been playing Call of Duty 4 because your hardware isn't up to par, a better "$200 question" is how the new Call of Duty runs. COD4 is one of those few upgrade worthy games, I'm pretty sure that Far Cry 2 is not. I technically wouldn't have to upgrade my setup to run it, and I can't even bring myself to pay $50.00 for the game. I'm not sure that many of you out there would want to spend even more than $50 to run this game. Most of us can't be upgrading for any old system hog that is released.
Of course, if you're shopping for a new video card and one of them comes with a game you're interested in, it's going to sweeten the deal. When I was shopping, I was almost lured in by one that had "The Witcher" included. I knew I wouldn't buy that game separetely but it sounded interesting enough to lure me. It's all about the package and the price. Would I recommend the 4850 based on my experience? Absolutely. But NVIDIA is a great company and has been catching up nicely with driver updates. The only beef I have against NVIDIA is that they've been renaming their old parts with new names and that is absolutely unethical. Heck, Nvidia's naming scheme is so bizzarre that a 8800GT 640mb is considerably worse than a 8800GT 512MB.
Now, back to my original question... if the 4850 1GB does, in fact, perform substantially better than the 512MB one, I would think it would put it right at the top of the list for this game.
strikeback03 - Wednesday, November 26, 2008 - link
Actually, nvidia's naming scheme is so bizarre that while I don't think there was an 8800GT 640, there was an 8800GTS 640 and an 8800GTS 512, and performance order went 8800GTS 640 < 8800GT 512 < 8800GTS 512. How is a customer supposed to make sense of that?SiliconDoc - Friday, November 28, 2008 - link
Yes, and the 9800GT with the bios updated old core - the 8800GT - or in the case of the Asus Ultimate (now sold out everywhere it seems ) the 8800GTS - then the ddr2 vs ddr3 - not to mention that smae issue with ATI - now ddr2, ddr3, ddr4 - one has to be quite careful in what they finally purchase, huh. LOLThen you have the brands issues and the rebates and the OC issues - the ram type on the cards that overclocks better or not ...
I think NV is still getting some review diss because of their confused naming convention which so many considered trickery or too messy to sort out - or time consuming... so I think there's part of the fan issue opposition.
Nonetheless, I'm glad I chose what I did based upon price and package and all the research I could muster before purchase - I waited quite a while and luckily those 6 months saw a massive output of new card releases - I could have just as easily went with an ATI release with some great deal on price and a game - I'm sure it was my excellent skills but wouldn't argue much with someone calling it luck. LOL
I see so often reading all over the net at all the popualr and unpopular places - ATI people chiming in that they don't have a problem... and I can't think of really a single case of an NV fan chiming in, in that fashion - so that tells me one thing....
No matter how many ATI users have had zero problems their entire lives in any OS with ATI cards including any game ever made or thought of, the very fact they have to constantly tell everyone that means :> THERE'S A LOT OF OTHER PEOPLE HAVING PROBLEMS WITH ATI.
I suppose I could be wrong, and instead - every ATI buyer is an absolutely masterous OS and game installer and configurator - and likewise all the uncomplaining NV users are oafs who are so noob skilled they can't properly install an ATI card to save their lives... NAHHHHHH !
kr7400 - Tuesday, December 2, 2008 - link
Can you please fucking die? Preferably by getting crushed to death in a garbage compactor, by getting your face cut to ribbons with a pocketknife, your head cracked open with a baseball bat, your stomach sliced open and your entrails spilled out, and your eyeballs ripped out of their sockets. *beep* bitch
I would love to kick you hard in the face, breaking it. Then I'd cut your stomach open with a chainsaw, exposing your intestines. Then I'd cut your windpipe in two with a boxcutter. Then I'd tie you to the back of a pickup truck, and drag you, until your useless *beep* corpse was torn to a million *beep* useless, bloody, and gory pieces.
Hopefully you'll get what's coming to you. *beep* bitch
I really hope that you get curb-stomped. It'd be hilarious to see you begging for help, and then someone stomps on the back of your head, leaving you to die in horrible, agonizing pain. *beep*
Shut the *beep* up f aggot, before you get your face bashed in and cut to ribbons, and your throat slit.
You're dead if I ever meet you in real life, f ucker. I'll f ucking kill you.
I would love to f ucking send your f ucking useless ass to the hospital in intensive care, fighting for your worthless life.
http://www.youtube.com/watch?v=Po0j4ONZRGY">http://www.youtube.com/watch?v=Po0j4ONZRGY
I wish you a truly painful, bloody, gory, and agonizing death, *beep*
7eki - Tuesday, November 25, 2008 - link
Problem with stuttering can be removed by typing for example "gfx_maxfps 30" in console. Usually stuttering appears after loading a game, or when there is someone in a hut near you who you will have to talk to. On Catalyst 8.10 turning off the AA and typing this command fixes the problem. On 8.11 game works perfectly in 1600x1200, ultra detail and 2 times AA (with previously mentioned command). Sometimes when there are lots of things going on FPS drop to min 25, but it's still a great framerate for what you pay for this card and U can C in the game. Firstly I thought that it was something wrong with the vsync or that sort of stuff. It's definately a problem connected with memory buffer. I remember that ATI had similar problems in F.E.A.R. on their x800 series with 256MB but they have fixed it. For me FC2 on 4850 works as good or even better as it does on my friend's 9800GTX.Hawkmoon - Tuesday, November 25, 2008 - link
Any word on what drivers were used for the nVidia cards?And what was the system used for these tests?? (memory/cpu/mobo etc)
Hawkmoon - Tuesday, November 25, 2008 - link
I guess I missed it... or they updated the 2nd page.Before we get started, let's take a look at our test setup:
Platform: ASUS Rampage II Extreme, Core i7-965, 6GB DDR3-1333, Intel SSD
AMD Driver: Final 8.10 hotfix
NVIDIA Driver: 180.44
rocky1234 - Monday, November 24, 2008 - link
Well as I said in those AMD forums to a few guys there & this was after reading their posts or system configs is that alot of the time a lot of the issues are not from The video card or the drivers but from a badly configered system or a system that is overclcoked to far or even worse spyware or viruses & yes a lot of those system do have a unhandy program like Norton 360 installed on them.I run the 4870x2 & have not had any BSOD's related to the video card itself yes I have had a BSOD here & there but it was form overclocking the CPU to far EG: when I tried to push my Intel Quad core to 4.1Ghz which in this case was a issue for the CPU but is happy to run all day at 4.0Ghz but I run it at 3.9GHZ to be safe & have a stable system.
After having owned a Nvidia gaming card & seeing BSODs pretty much daily & they were related to the Drivers I was more than happy to pawn that card off to another system I own.
BubbaJudge - Monday, November 24, 2008 - link
Since the 8.10 hotfix, many of us running Vista and 4850/4870 in CF cannot run the hotfix or the 8.11s without a BSOD upon reaching the desktop. One card, no problem, two cards, infinite BSOD loops. Never mind it being just a Far Cry problem. We cannot run our machines with current AMD drivers.We now are at 5 pages of angry frustrated users over at the AMD forums
http://forums.amd.com/game/messageview.cfm?catid=2...">http://forums.amd.com/game/messageview....&thr...
Was hoping you guys would find this, I think you came very close, and am very happy to see you come down on the absurdity which is now Catalyst.
I have been running ATI since the 9700 pro, but I've had enough of struggling with ATI multicard graphics solutions(oxymoron).