Workstation Graphics: AGP Cross Section 2004
by Derek Wilson on December 23, 2004 4:14 PM EST- Posted in
- GPUs
SPECViewperf 8.0.1 Performance
For our SPECviewperf tests, we will look at graphs of the overall weighted scores for each viewset. We have also listed the scores for the individual tests for each viewset. For each section, we will begin by listing the description of the viewset from the SPEC website, and then analysing the data.For futher details on how SPECviewperf scores are compiled, please see the SPEC website.
All cards were set to their default professional graphics settings, whatever those happened to be, before running SPECviewperf.
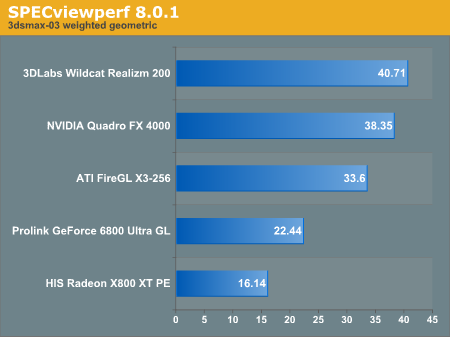
3dsmax Viewset (3dsmax-03)
"The 3dsmax-03 viewset was created from traces of the graphics workload generated by 3ds max 3.1. To ensure a common comparison point, the OpenGL plug-in driver from Discreet was used during tracing.The Wildcat Realizm 200 leads in this benchmark, followed by the Quadro FX 4000. This is quite interesting, since by street price, the Realizm is the cheapest card that we have in the bunch. ATI's MSRP is lower than the 3Dlabs part, but value is all in purchasing power and performance.
The models for this viewset came from the SPECapc 3ds max 3.1 benchmark. Each model was measured with two different lighting models to reflect a range of potential 3ds max users. The high-complexity model uses five to seven positional lights as defined by the SPECapc benchmark and reflects how a high-end user would work with 3ds max. The medium-complexity lighting models use two positional lights, a more common lighting environment.
The viewset is based on a trace of the running application and includes all the state changes found during normal 3ds max operation. Immediate-mode OpenGL calls are used to transfer data to the graphics subsystem."
The DCC side of the workstation market isn't as large as CAD/CAM, but 3DStudio is still an important application. Of course, this viewset tests straight OpenGL performance, and each of these workstation cards have a custom driver for 3DStudio Max, which we will test in the SEPCapc portion of our benchmark suite.
| SPECviewperf 8.0.1 3dsmax-03 | ||||||||||||||
| 1 | 2 | 3 | 4 | 5 | 6 | 7 | 8 | 9 | 10 | 11 | 12 | 13 | 14 | |
| Quadro FX 4000 | 38.6 | 38.5 | 21.8 | 18.8 | 75 | 53.7 | 40.6 | 30.6 | 17.2 | 70.3 | 25.3 | 26.2 | 21 | 20.1 |
| Wildcat Realizm 200 | 38.6 | 38 | 30.2 | 24.3 | 74.1 | 62.1 | 43.5 | 40.4 | 28.3 | 68.7 | 24.1 | 24.1 | 18.3 | 18.3 |
| FireGL X3-256 | 32.2 | 27.3 | 23.4 | 18.5 | 62.8 | 51 | 28.9 | 31.9 | 18.6 | 66.6 | 20.5 | 20.6 | 16 | 16.1 |
| GeForce 6800 U GC | 17.5 | 15.9 | 14.8 | 14.7 | 42.4 | 29.2 | 27.1 | 19.1 | 14.9 | 40.8 | 14.2 | 14.1 | 11.5 | 11.2 |
| Radeon X800 XTPE | 12 | 8.09 | 12.5 | 10.7 | 35.9 | 23.6 | 11.6 | 15.8 | 10 | 32.7 | 11.4 | 6.37 | 9.3 | 7.86 |
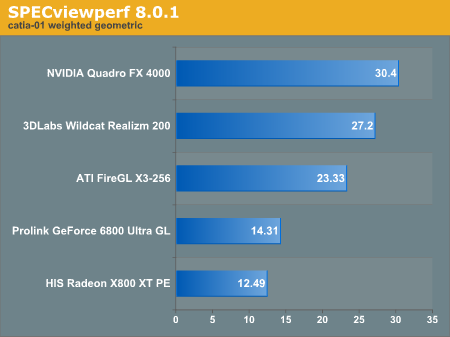
CATIA Viewset (catia-01)
"The catia-01 viewset was created from traces of the graphics workload generated by the CATIATM V5R12 application from Dassault Systemes.The state change information found in the CATIA is a big part of the improvement in SPECviewperf 8. The nature of OpenGL as a state machine is the major advantage of the API in workstation applications. The viewing and manipulation of state are key elements in workstation graphics today. Taking a look at performance here, we see the Quadro FX 4000 taking the lead on this one followed by the Realizm 200.
Three models are measured using various modes in CATIA. Phil Harris of LionHeart Solutions, developer of CATBench2003, supplied SPEC/GPC with the models used to measure the CATIA application. The models are courtesy of CATBench2003 and CATIA Community.
The car model contains more than two million points. SPECviewperf replicates the geometry represented by the smaller engine block and submarine models to increase complexity and decrease frame rates. After replication, these models contain 1.2 million vertices (engine block) and 1.8 million vertices (submarine).
State changes as made by the application are included throughout the rendering of the model, including matrix, material, light and line-stipple changes. All state changes are derived from a trace of the running application. The state changes put considerably more stress on graphics subsystems than the simple geometry dumps found in older SPECviewperf viewsets.
Mirroring the application, draw arrays are used for some tests and immediate mode used for others."
| SPECviewperf 8.0.1 catia-01 | |||||||||||
| 1 | 2 | 3 | 4 | 5 | 6 | 7 | 8 | 9 | 10 | 11 | |
| Quadro FX 4000 | 48.9 | 37.2 | 26.9 | 27.9 | 19 | 47.8 | 29.6 | 28.9 | 19 | 23.2 | 46.1 |
| Wildcat Realizm 200 | 52.1 | 38.6 | 15.8 | 29.7 | 18.9 | 63.3 | 32.5 | 27.6 | 22 | 20.6 | 13.7 |
| FireGL X3-256 | 39.7 | 25.8 | 19.1 | 22.8 | 16.2 | 34 | 25.2 | 18.8 | 15 | 19.1 | 34.8 |
| GeForce 6800 U GC | 20.2 | 22.5 | 11.5 | 12.6 | 8.9 | 31.1 | 17.2 | 4.49 | 11.2 | 12.7 | 27.2 |
| Radeon X800 XTPE | 20.9 | 10.3 | 10.9 | 11.7 | 7.38 | 26.7 | 13.1 | 12.5 | 8.86 | 7.41 | 21 |
EnSight (ensight-01)
"The ensight-01 viewset replaces the Data Explorer (dx) viewset. It represents engineering and scientific visualization workloads created from traces of CEI's EnSight application.This time around, we see the FireGL X3-256 jump to the head of the pack. Even though the X3-256 has trailed in the previous tests, it has managed to clearly lead the EnSight performance tests.
CEI contributed the models and suggested workloads. Various modes of the EnSight application are tested using both display-list and immediate-mode paths through the OpenGL API. The model data is replicated by SPECviewperf 8.0 to generate 3.2 million vertices per frame.
State changes as made by the application are included throughout the rendering of the model, including matrix, material, light and line-stipple changes. All state changes are derived from a trace of the running application. The state changes put considerably more stress on graphics subsystems than the simple geometry dumps found in older viewsets.
Mirroring the application, both immediate-mode and display-list modes are measured."
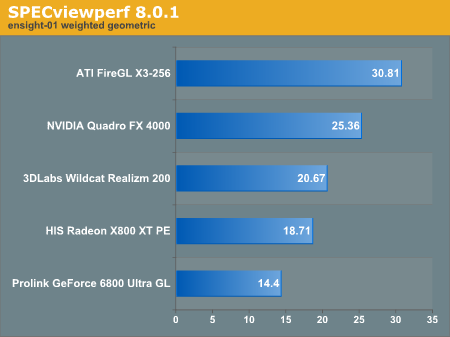
Six out of the nine tests are led by the FireGL X3. Interestingly, in tests 5, 6, and 8, the Realizm 200 leads both the FireGL X3-256 and the Quadro FX 4000. Test 1 has a weight of 12, while the following 8 tests have a weight of 11 each.
| SPECviewperf 8.0.1 ensight-01 | |||||||||
| 1 | 2 | 3 | 4 | 5 | 6 | 7 | 8 | 9 | |
| Quadro FX 4000 | 42.7 | 35.4 | 35.6 | 31.1 | 13.7 | 13.6 | 31 | 13.8 | 31 |
| Wildcat Realizm 200 | 24.5 | 20.9 | 26.7 | 23 | 16 | 15.9 | 23 | 16 | 23 |
| FireGL X3-256 | 53.6 | 50 | 53.7 | 44.6 | 12.3 | 12.3 | 44.7 | 12.3 | 44.6 |
| GeForce 6800 U GC | 11.6 | 3.98 | 39.3 | 34.1 | 7.22 | 7.23 | 34 | 7.26 | 34 |
| Radeon X800 XTPE | 14.1 | 54.4 | 45.5 | 34.8 | 5.84 | 5.78 | 34.8 | 5.8 | 34.8 |
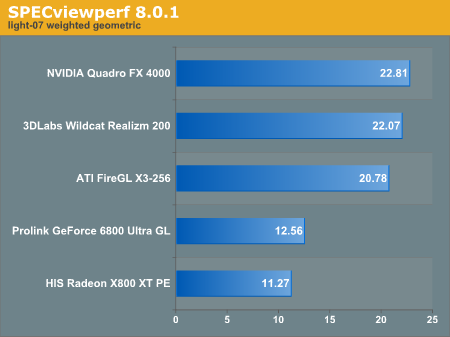
Lightscape Viewset (light-07)
"The light-07 viewset was created from traces of the graphics workload generated by the Lightscape Visualization System from Discreet Logic. Lightscape combines proprietary radiosity algorithms with a physically-based lighting interface.The Quadro FX 4000 outpeforms the Wildcat Realizm by about 3.4% in the lighscape test. This time, the FireGL X3-256 is back where we would expect based on ATI's positioning of the product.
The most significant feature of Lightscape is its ability to accurately simulate global illumination effects by pre-calculating the diffuse energy distribution in an environment and storing the lighting distribution as part of the 3D model. The resulting lighting "mesh" can then be rapidly displayed."
| SPECviewperf 8.0.1 light-07 | |||||
| 1 | 2 | 3 | 4 | 5 | |
| Quadro FX 4000 | 23.7 | 37.5 | 18.1 | 13.8 | 27.8 |
| Wildcat Realizm 200 | 25.4 | 44.3 | 14.1 | 12.8 | 25.8 |
| FireGL X3-256 | 24.8 | 44.5 | 12.5 | 11.6 | 24.2 |
| GeForce 6800 U GC | 13.2 | 24.2 | 9.06 | 6.75 | 16 |
| Radeon X800 XTPE | 12.1 | 22.6 | 7.96 | 5.89 | 14.2 |
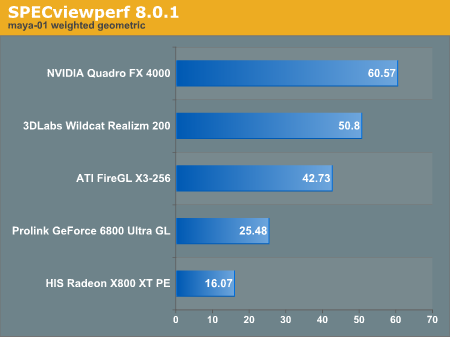
Maya Viewset (maya-01)
"The maya-01 viewset was created from traces of the graphics workload generated by the Maya V5 application from Alias.The clear leader in this test is the Quadro FX 4000. The NVIDIA part leads every test under Maya by a large margin. The differences between each card are very large all the way down to the X800 XT PE.
The models used in the tests were contributed by artists at NVIDIA. Various modes in the Maya application are measured.
State changes as made by the application are included throughout the rendering of the model, including matrix, material, light and line-stipple changes. All state changes are derived from a trace of the running application. The state changes put considerably more stress on graphics subsystems than the simple geometry dumps found in older viewsets.
As in the Maya V5 application, array element is used to transfer data through the OpenGL API."
| SPECviewperf 8.0.1 maya-01 | |||||||||
| 1 | 2 | 3 | 4 | 5 | 6 | 7 | 8 | 9 | |
| Quadro FX 4000 | 152 | 52.5 | 37.2 | 42.6 | 27.6 | 100 | 82.3 | 82.7 | 49.6 |
| Wildcat Realizm 200 | 126 | 41.1 | 30.8 | 33.3 | 17.7 | 96.3 | 79.8 | 76.8 | 44.7 |
| FireGL X3-256 | 110 | 33.3 | 23.2 | 29.2 | 20.6 | 82 | 51.1 | 63.7 | 37.2 |
| GeForce 6800 U GC | 54 | 24.5 | 16 | 12.8 | 10 | 52 | 39.5 | 37.4 | 23.7 |
| Radeon X800 XTPE | 25.2 | 14.9 | 9.02 | 8.03 | 7.2 | 36.1 | 26.7 | 25 | 16.3 |
Pro/ENGINEER (proe-03)
"The proe-03 viewset was created from traces of the graphics workload generated by the Pro/ENGINEER 2001TM application from PTC.This is an absolutely huge test in terms of data and workload placed on the cards. The Quadro FX 4000 leads here, but the 3 workstation cards really are close and excel in different areas. Check out the table and see what we mean.
Two models and three rendering modes are measured during the test. PTC contributed the models to SPEC for use in measurement of the Pro/ENGINEER application. The first of the models, the PTC World Car, represents a large-model workload composed of 3.9 to 5.9 million vertices. This model is measured in shaded, hidden-line removal, and wireframe modes. The wireframe workloads are measured both in normal and antialiased mode. The second model is a copier. It is a medium-sized model made up of 485,000 to 1.6 million vertices. Shaded and hidden-line-removal modes were measured for this model.
This viewset includes state changes as made by the application throughout the rendering of the model, including matrix, material, light and line-stipple changes. The PTC World Car shaded frames include more than 100MB of state and vertex information per frame. All state changes are derived from a trace of the running application. The state changes put considerably more stress on graphics subsystems than the simple geometry dumps found in older viewsets.
Mirroring the application, draw arrays are used for the shaded tests and immediate mode is used for the wireframe. The gradient background used by the Pro/E application is also included to model the application workload better."
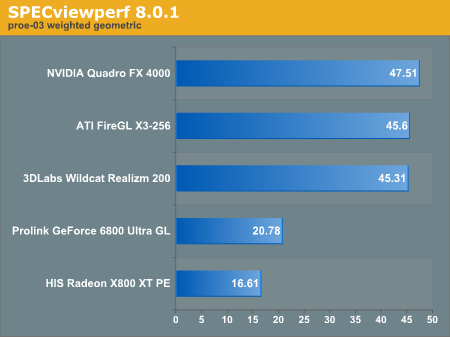
Tests 1, 2 and 3 are clearly led by the FireGL X3-256. Unfortunately for ATI, the rest of the tests fall very short. The Wildcat Realizm 200 is much closer to the Quadro FX 4000 than it appears in the overall result. It leads 3 out of 7 benchmarks and is close in two of its losses. Test number 6 really pushes the Quadro up in score. It is data like this that gets lost in geometric means sometimes.
| SPECviewperf 8.0.1 proe-03 | |||||||
| 1 | 2 | 3 | 4 | 5 | 6 | 7 | |
| Quadro FX 4000 | 26.6 | 31 | 24.9 | 53.4 | 53.2 | 170 | 52.6 |
| Wildcat Realizm 200 | 27.1 | 31.8 | 24.5 | 54.2 | 45.2 | 143 | 51.3 |
| FireGL X3-256 | 38.3 | 45.9 | 31.7 | 38.4 | 36 | 135 | 42.9 |
| GeForce 6800 U GC | 11.2 | 13.1 | 15.3 | 33.5 | 8.55 | 88.5 | 32.7 |
| Radeon X800 XTPE | 7.33 | 8.63 | 9.05 | 22.7 | 22.5 | 44.2 | 23.8 |
SolidWorks Viewset (sw-01)
"The sw-01 viewset was created from traces of the graphics workload generated by the Solidworks 2004 application from Dassault Systemes.The Realizm 200 comes out on top again in this benchmark, followed by the Quadro FX 4000, with the ATI card bringing up the rear. Here, we see a situation similar to the proe test when we look at the table of data.
The model and workloads used were contributed by Solidworks as part of the SPECapc for SolidWorks 2004 benchmark.
State changes as made by the application are included throughout the rendering of the model, including matrix, material, light and line-stipple changes. All state changes are derived from a trace of the running application. The state changes put considerably more stress on graphics subsystems than the simple geometry dumps found in older viewsets.
Mirroring the application, draw arrays are used for some tests and immediate mode used for others."
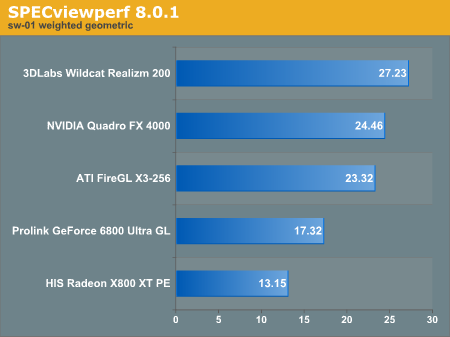
The Quadro FX 4000 leads in tests 2, 3, and 4. Test 7 is really what causes the major dichotomy in scoring between the two parts in the overall test. The Wildcat Realizm 200 is still the better part for the job under the SolidWords viewset, but it's good to step back and take a look at the individual test data.
| SPECviewperf 8.0.1 sw-01 | ||||||||
| 1 | 2 | 3 | 4 | 5 | 6 | 7 | 8 | |
| Quadro FX 4000 | 34.4 | 12.4 | 14.2 | 17.2 | 40.5 | 28.9 | 49.3 | 21.3 |
| Wildcat Realizm 200 | 43.4 | 9.76 | 12.6 | 15.5 | 48 | 32.7 | 103 | 22.6 |
| FireGL X3-256 | 26.6 | 12.1 | 15.3 | 18.5 | 39.5 | 25.5 | 52.4 | 18.2 |
| GeForce 6800 U GC | 31.8 | 10.6 | 10.6 | 13.8 | 32.8 | 12.2 | 33.4 | 12.3 |
| Radeon X800 XTPE | 23.7 | 6.04 | 6.37 | 8.04 | 18.3 | 11.5 | 52.1 | 11.1 |
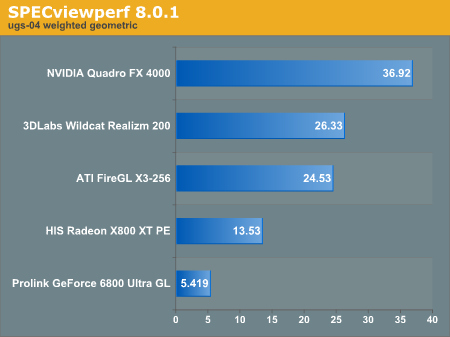
Unigraphics (ugs-04)
"The ugs-04 viewset was created from traces of the graphics workload generated by Unigraphics V17.The NVIDIA workstation solution is much better able to handle this workload. The huge models with shaded with transparencies turned on are easily rendered on the Quadro FX 4000.
The engine model used was taken from the SPECapc for Unigraphics V17 application benchmark. Three rendering modes are measured: shaded, shaded with transparency, and wireframe. The wireframe workloads are measured both in normal and anti-alised mode. All tests are repeated twice, rotating once in the center of the screen and then moving about the frame to measure clipping performance.
The viewset is based on a trace of the running application and includes all the state changes found during normal Unigraphics operation. As with the application, OpenGL display lists are used to transfer data to the graphics subsystem. Thousands of display lists of varying sizes go into generating each frame of the model.
To increase model size and complexity, SPECviewperf 8.0 replicates the model two times more than the previous ugs-03 test."
| SPECviewperf 8.0.1 ugs-04 | ||||||||
| 1 | 2 | 3 | 4 | 5 | 6 | 7 | 8 | |
| Quadro FX 4000 | 30.1 | 34.7 | 27.8 | 31.2 | 51 | 62.2 | 47.5 | 49.8 |
| Wildcat Realizm 200 | 24.3 | 26.8 | 22 | 23.2 | 38.8 | 31.4 | 30.2 | 26.7 |
| FireGL X3-256 | 18.5 | 19.1 | 13.9 | 14.4 | 53.4 | 56.4 | 53.7 | 53.3 |
| GeForce 6800 U GC | 3.29 | 3.86 | 3.01 | 3.52 | 27.3 | 31.9 | 4.94 | 7.38 |
| Radeon X800 XTPE | 11.9 | 12 | 9.13 | 9.13 | 22.2 | 22.6 | 22.2 | 22.4 |
To sum up SPECviewperf 8.0.1 Performance, we have the FireGL X3-256 Leading 1 benchmark (ensight), the Wildcat Realism 200 leading 2 benchmarks (3dsmax, sw), and the Quadro FX 4000 taking pole position on the other 5 tests.
Now, let's put the cards to the test inside applications and see if performance holds up.


25 Comments
View All Comments
Jeanlou - Thursday, December 1, 2005 - link
Hello,I just bumped into AnandTech Video Card Tests, and I'm really impressed !
As a Belgian Vision Systems Integration Consultant (since 1979), I'm very interrested about the ability to compare these 3 cards (Realizm 200 vs FireGL X3 256 vs NVIDIA Quatro FX 4000).
I just had a bad experience with the Realizm 200 (!)
On a ASUS NCCH-DL motherboard, Dual Xeon 2.8GHz, 2GB DDR 400, Seagate SCSI Ultra 320 HDD, 2 EIZO monitors (Monitor N°1= L985EX at 1600x1200 px), (Monitopr N°2= L565 at 1280x1024 px), Windows XP Pro SP2 x32bit partition C:\ 16GB, Windows XP Pro x64bit edition partition D:\ 16GB, plus Extended partions (2 logical E:\ and F:\). All NTFS.
Using the main monitor for images analyses (quality control) and the slave monitor for tools, I was unable to have a stable image at 1600 by 1200 pixels. While the Wildcat4 - 7110, or even the VP990 Pro have a very stable screen at maximum resolution. But the 7110 and the VP990 Pro don't have drivers for Window XP x64bit.
Tried everything, latest BIOS, latest drive for ChipSet...
Even 3Dlabs was unable to give me the necessary support and do not answer anymore !
As soon I reduced the resolution from the main monitor to 1280 by 1024, was everything stable, but that's not what I want, I need the maximum resolution on the main monitor.
The specs from 3Dlabs resolution table is giving 3840 by 2400 pixels maximum!
I send it back, and I'm looking for an other card.
I wonder if the FireGL X3 256 will do the job ?
We also use an other monitor from EIZO (S2410W) with 1920 by 1200 pixels !
What are exactly the several resolutions possible with the FireGL X3 256 using 2 monitors ? I cannot find it on the specs.
Any comment will be appreciated,
Best regards,
Jean
kaissa - Sunday, February 20, 2005 - link
Excellent article. I hope that you make workstation graphic card comparision a regular article. How about an article on workstation notebooks? Thanks a lot.laverdir - Thursday, December 30, 2004 - link
dear derek wilson,could you tell us how much is the performance
difference between numa and uma in general
on this tests..
and it would be great if you could post maya
related results for guadro 4k with numa enabled..
seasonal greetings
RedNight - Tuesday, December 28, 2004 - link
This is the best workstation graphics card review I have read in ages. Not only does it present the positive and negatives of each the principal cards in question, it presents them in relationship to high end mainsteam cards and thereby helps many, including myself, understand the real differences in performance. Also, by inovatingly including AutoCAD and Gaming Tests one gets a clear indication of when the workstation cards are necessary and when they would be a waste of money. ThanksDerekWilson - Monday, December 27, 2004 - link
Dubb,Thanks for letting us know about that one :-) We'll have to have a nice long talk with NV's workstation team about what exactly is going on there. They very strongly gave us the idea that the featureset wasn't present on geforce cards.
#19, NUMA was disabled because most people running a workstation with 4 or fewer GB of RAM on a 32 machine will not be running with the pae kernel installed. We wanted to test with a setup most people would be running under the circumstances. We will test NUMA capabilities in the future.
#20,
When we test workstation CPU performance or system performance, POVRay will be a possible inclusion. Thanks for the suggestion.
Derek Wilson
mbhame - Sunday, December 26, 2004 - link
Please include POVRay benchies in Workstation tests.Myrandex - Saturday, December 25, 2004 - link
I wonder why NUMA was fully supported but yet disabled. Maybe instabilities or something.Dubb - Friday, December 24, 2004 - link
http://newbietech.net/eng/qtoq/index.phphttp://forums.guru3d.com/showthread.php?s=2347485b...
Dubb - Friday, December 24, 2004 - link
uhhh.. my softquadro'd 5900 ultra begs to differ. as would all the 6800 > qfx4000 mods being done by people on guru3d's rivatuner forum.I thought you guys knew that just because nvida says something doesn't mean it's true?
they must consider "physically different sillicon" to be "we moved a resistor or two"...
DerekWilson - Friday, December 24, 2004 - link
By high end features, I wasn't talking about texturing or prgrammatic vertex or fragment shading (which is highend in the consumer space).I was rather talking about hardware support for: AA lines and points, overlay plane support, two-sided lighting (fixed function path), logic operations, fast pixel read-back speeds, and dual 10-bit 400MHz RAMDACs and 2 dual-link DVI-I connectors supporting 3840x2400 on a single display (the IBM T221 comes to mind).
There are other features, but these are key. In products like Maya and 3D Studio, not having overlay plane support creates an absolutely noticable performance hit. It really does depend on how you push the cards. We do prefer the in application benchmarks to SPECveiwperf. Even the SPECapc tests can give a better feel for where things will fall -- because the entire system is a factor rather than just the gfx card and CPU.
#14, Dubb -- I hate to be the one to tell you this -- GeForce and Quadro are physically different silicon now (NV40 and NV40GL). AFAIK, ever since GF4/Quadro4, it has been impossible to softquadro an nvidia card. The Quadro team uses the GeForce as it's base core, but then adds on workstation class features.