OCZ Vertex 460 (240GB) Review
by Kristian Vättö on January 22, 2014 9:00 AM EST- Posted in
- Storage
- SSDs
- OCZ
- Indilinx
- Vertex 460
AnandTech Storage Bench 2011
Two years ago we introduced our AnandTech Storage Bench, a suite of benchmarks that took traces of real OS/application usage and played them back in a repeatable manner. Anand assembled the traces out of frustration with the majority of what we have today in terms of SSD benchmarks.
Although the AnandTech Storage Bench tests did a good job of characterizing SSD performance, they weren't stressful enough. All of the tests performed less than 10GB of reads/writes and typically involved only 4GB of writes specifically. That's not even enough exceed the spare area on most SSDs. Most canned SSD benchmarks don't even come close to writing a single gigabyte of data, but that doesn't mean that simply writing 4GB is acceptable.
Originally the benchmarks were kept short enough that they wouldn't be a burden to run (~30 minutes) but long enough that they were representative of what a power user might do with their system.
1) The MOASB, officially called AnandTech Storage Bench 2011 - Heavy Workload, mainly focuses on the times when your I/O activity is the highest. There is a lot of downloading and application installing that happens during the course of this test. Our thinking was that it's during application installs, file copies, downloading and multitasking with all of this that you can really notice performance differences between drives.
2) We tried to cover as many bases as possible with the software incorporated into this test. There's a lot of photo editing in Photoshop, HTML editing in Dreamweaver, web browsing, game playing/level loading (Starcraft II & WoW are both a part of the test) as well as general use stuff (application installing, virus scanning). We've included a large amount of email downloading, document creation and editing as well. To top it all off we even use Visual Studio 2008 to build Chromium during the test.
The test has 2,168,893 read operations and 1,783,447 write operations. The IO breakdown is as follows:
| AnandTech Storage Bench 2011 - Heavy Workload IO Breakdown | ||||
| IO Size | % of Total | |||
| 4KB | 28% | |||
| 16KB | 10% | |||
| 32KB | 10% | |||
| 64KB | 4% | |||
Only 42% of all operations are sequential, the rest range from pseudo to fully random (with most falling in the pseudo-random category). Average queue depth is 4.625 IOs, with 59% of operations taking place in an IO queue of 1.
AnandTech Storage Bench 2011 - Heavy Workload
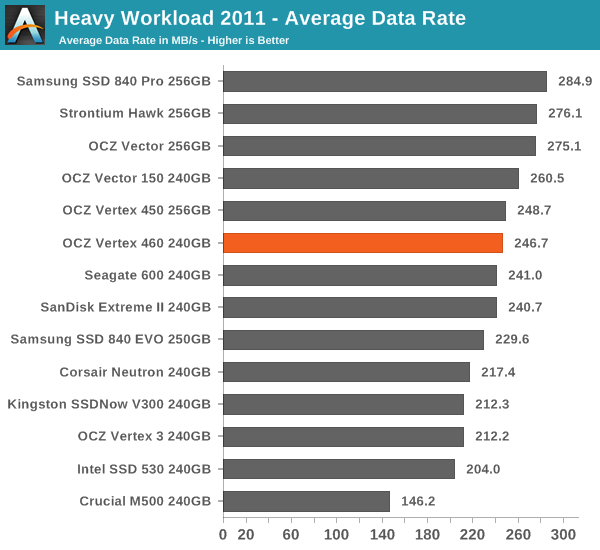
The full results, including disk busy times and read/write separations, can be found in our Bench.
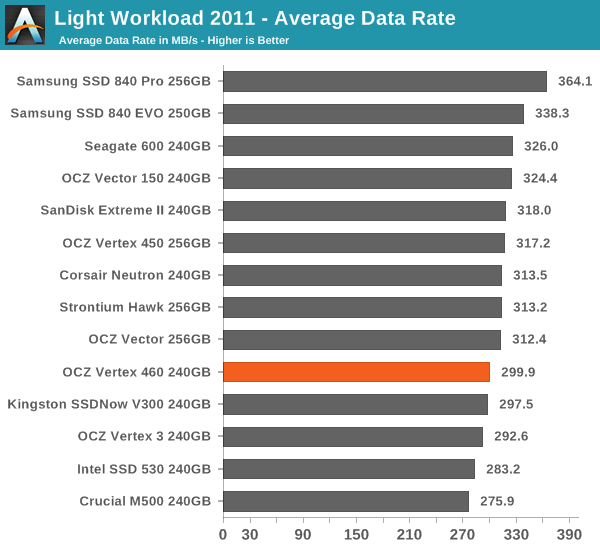
AnandTech Storage Bench 2011 - Light Workload
Our light workload actually has more write operations than read operations. The split is as follows: 372,630 reads and 459,709 writes. The relatively close read/write ratio does better mimic a typical light workload (although even lighter workloads would be far more read centric). There's lots of web browsing, photo editing (but with a greater focus on photo consumption), video playback as well as some application installs and gaming.
The I/O breakdown is similar to the heavy workload at small IOs, however you'll notice that there are far fewer large IO transfers. Interestingly, the 480GB drive actually comes out ahead in this case, suggesting it's more capable at light workloads.
| AnandTech Storage Bench 2011 - Light Workload IO Breakdown | ||||
| IO Size | % of Total | |||
| 4KB | 27% | |||
| 16KB | 8% | |||
| 32KB | 6% | |||
| 64KB | 5% | |||


69 Comments
View All Comments
blanarahul - Wednesday, January 22, 2014 - link
The 250 GB 840 EVO achieves 260 MB/s write speeds. 120 GB EVO achieves 140 MB/s. 500 GB EVO should achieve 520 MB/s bit it only achieves 420 MB/s. Why??blanarahul - Wednesday, January 22, 2014 - link
I am talking about non-Turbowrite speeds btw.rufuselder - Thursday, October 9, 2014 - link
OCZ Vertex 460 is one of the worst options for storage out there in my opinion (each time I try it out, I get just as disappointed). /Rufus from http://www.consumertop.com/best-computer-storage-g...DanNeely - Wednesday, January 22, 2014 - link
Having more NAND dies to multiiplex IO over only helps for some parts of the write process; and the more of them you have the less adding still more will help because other factors dominate more of the total time (Amdahl's law). As a result going to 500 from 250 gives less of a percentage boost than going to 250 from 120.I suspect in the case of the 500, because all the mid/top end drives are clustering in a narrow performance band, that SATA III bottlenecking is coming into play in addition to limitations within the SSD itself.
blanarahul - Wednesday, January 22, 2014 - link
Gee thanks. BTW, SATA III maxes out around 540 MB/s for writes. So it's a controller/firmware limitation.Gigaplex - Wednesday, January 22, 2014 - link
It's not that simple. You don't have to hit maximum utilisation to start feeling the limitations of SATA III.lmcd - Thursday, January 23, 2014 - link
I thought there weren't more packages but rather larger packages? If I'm wrong then yeah it's probably SATA limitations but if not it's because it's the same bandwidth allocated per packages as previously.lmcd - Thursday, January 23, 2014 - link
*weren't more packages once 250 GB is met, in the case of this model.Novuake - Wednesday, January 22, 2014 - link
Simple. Diminishing returns + limitations of SATA III.Shadowmaster625 - Wednesday, January 22, 2014 - link
It is amazing Toshiba would sully their own name by placing it next to "OCZ".