SandForce TRIM Issue & Corsair Force Series GS (240GB) Review
by Kristian Vättö on November 22, 2012 1:00 PM ESTAnandTech Storage Bench 2011
Last year we introduced our AnandTech Storage Bench, a suite of benchmarks that took traces of real OS/application usage and played them back in a repeatable manner. Anand assembled the traces out of frustration with the majority of what we have today in terms of SSD benchmarks.
Although the AnandTech Storage Bench tests did a good job of characterizing SSD performance, they weren't stressful enough. All of the tests performed less than 10GB of reads/writes and typically involved only 4GB of writes specifically. That's not even enough exceed the spare area on most SSDs. Most canned SSD benchmarks don't even come close to writing a single gigabyte of data, but that doesn't mean that simply writing 4GB is acceptable.
Originally we kept the benchmarks short enough that they wouldn't be a burden to run (~30 minutes) but long enough that they were representative of what a power user might do with their system. Later, however, we created what we refer to as the Mother of All SSD Benchmarks (MOASB). Rather than only writing 4GB of data to the drive, this benchmark writes 106.32GB. This represents the load you'd put on a drive after nearly two weeks of constant usage. And it takes a long time to run.
1) The MOASB, officially called AnandTech Storage Bench 2011—Heavy Workload, mainly focuses on the times when your I/O activity is the highest. There is a lot of downloading and application installing that happens during the course of this test. Our thinking was that it's during application installs, file copies, downloading, and multitasking with all of this that you can really notice performance differences between drives.
2) We tried to cover as many bases as possible with the software incorporated into this test. There's a lot of photo editing in Photoshop, HTML editing in Dreamweaver, web browsing, game playing/level loading (Starcraft II and WoW are both a part of the test), as well as general use stuff (application installing, virus scanning). We included a large amount of email downloading, document creation, and editing as well. To top it all off we even use Visual Studio 2008 to build Chromium during the test.
The test has 2,168,893 read operations and 1,783,447 write operations. The IO breakdown is as follows:
| AnandTech Storage Bench 2011—Heavy Workload IO Breakdown | ||||
| IO Size | % of Total | |||
| 4KB | 28% | |||
| 16KB | 10% | |||
| 32KB | 10% | |||
| 64KB | 4% | |||
Only 42% of all operations are sequential; the rest ranges from pseudo to fully random (with most falling in the pseudo-random category). Average queue depth is 4.625 IOs, with 59% of operations taking place in an IO queue of 1.
Many of you have asked for a better way to really characterize performance. Simply looking at IOPS doesn't really say much. As a result we're going to be presenting Storage Bench 2011 data in a slightly different way. We'll have performance represented as Average MB/s, with higher numbers being better. At the same time we'll be reporting how long the SSD was busy while running this test. These disk busy graphs will show you exactly how much time was shaved off by using a faster drive vs. a slower one during the course of this test. Finally, we will also break out performance into reads, writes, and combined. The reason we do this is to help balance out the fact that this test is unusually write intensive, which can often hide the benefits of a drive with good read performance.
There's also a new light workload for 2011. This is a far more reasonable, typical every day use case benchmark. It has lots of web browsing, photo editing (but with a greater focus on photo consumption), video playback, as well as some application installs and gaming. This test isn't nearly as write intensive as the MOASB but it's still multiple times more write intensive than what we were running last year.
We don't believe that these two benchmarks alone are enough to characterize the performance of a drive, but hopefully along with the rest of our tests they will help provide a better idea. The testbed for Storage Bench 2011 has changed as well. We're now using a Sandy Bridge platform with full 6Gbps support for these tests.
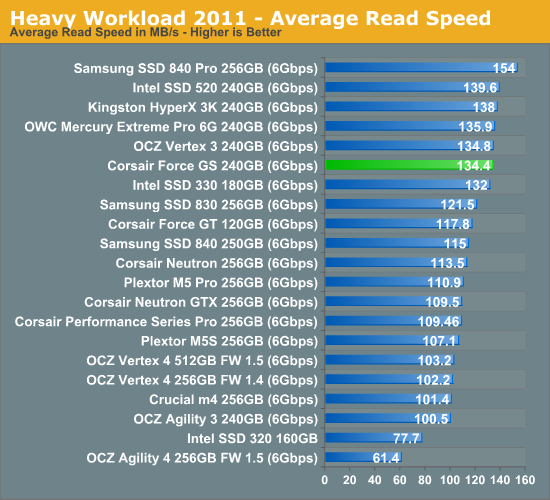
AnandTech Storage Bench 2011—Heavy Workload
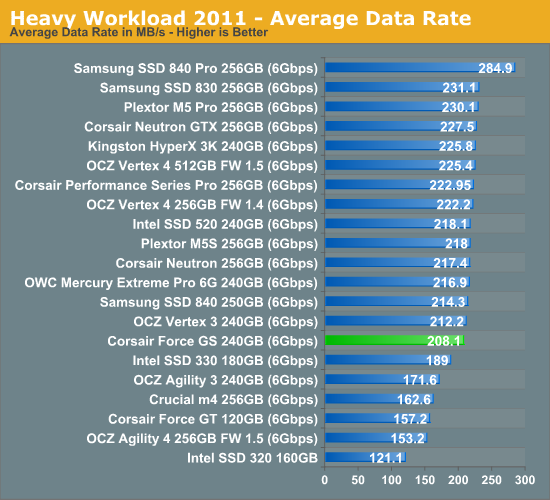
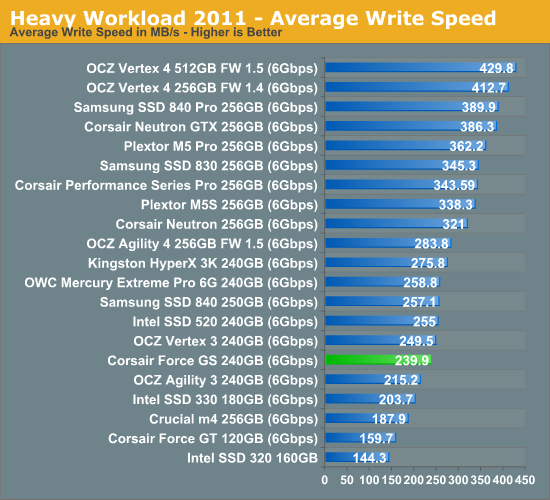
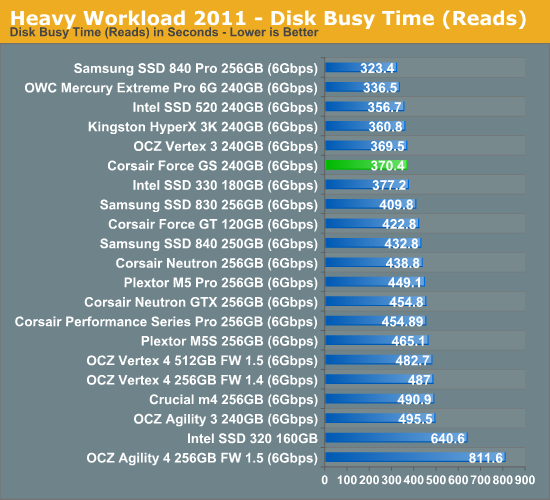
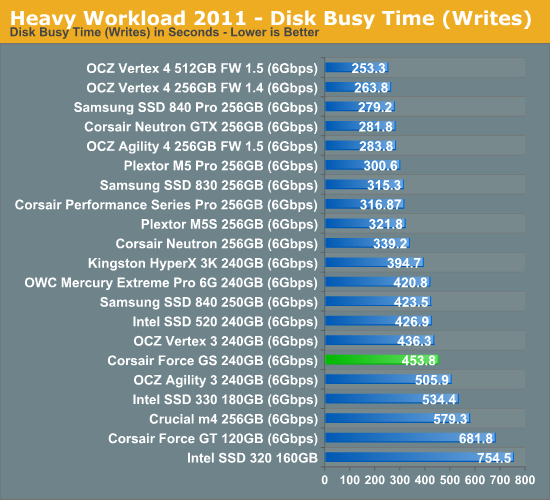
The anomalies in random write performance definitely show up in our Heavy storage suite as well. As the two graphs below show, read performance is completely normal but write speed is slower than usual.
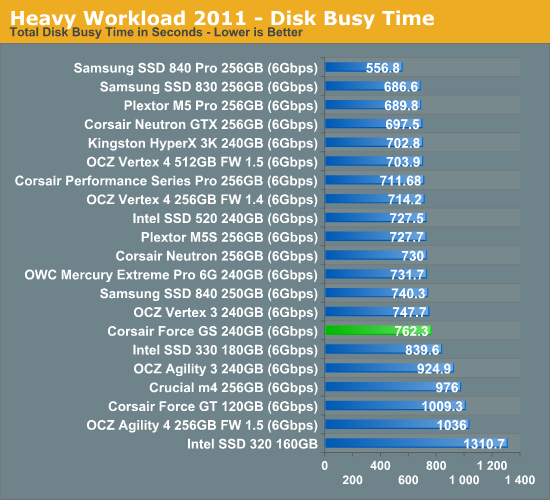
The next three charts just represent the same data, but in a different manner. Instead of looking at average data rate, we're looking at how long the disk was busy for during this entire test. Note that disk busy time excludes any and all idles; this is just how long the SSD was busy doing something:


56 Comments
View All Comments
bradcollins - Thursday, November 22, 2012 - link
One question, all of the tests at Anandtech for Sandforce performance after being hammered for a period of time are always over the entire drive. Do the drives maintain their performance if the random writes are only over 50% or 75% of the LBA's on the drive? Very few people actually fill up their SSD so I wonder if it is a truely relevant test?Impulses - Wednesday, November 28, 2012 - link
You will always eventually use all of your SSD, wear leveling algorithms will spread data across all NAND packages... A certain portion will always be marked "empty" if you haven't filled it to capacity, but that space has been issued and it's subject to the performance degradation conditions AT tests for.Bullwinkle J Moose - Thursday, November 22, 2012 - link
Time for an article on Cache Analysis?It looks to me as though the 1GB Dram Cache on the Intel DC S3700 is mainly responsible for smoothing out those peaks and valleys to deliver "Consistant" performance across the drive
As for trim.....
It's time to start with a fresh perspective on SSD's
Bullwinkle J Moose - Thursday, November 22, 2012 - link
I know Intel claimed otherwise on the dram usage, but I don't buy itSounds more likely they are just sending the competition on a wild goose chase
Bullwinkle J Moose - Thursday, November 22, 2012 - link
Reread DC S3700 review again256MB of the 1GB is used for cache
OK, my bad
Bullwinkle J Moose - Thursday, November 22, 2012 - link
DohIf I read it 5 more times I'll get it right eventually
extide - Saturday, November 24, 2012 - link
If it were that easy, don't you think other guys would have drives like the 3700 out?Kristian Vättö - Friday, November 23, 2012 - link
The problem with caching in general is that there is no good way to test how much write/read caching the drive is doing. All we got is what manufacturers tell us, which may or may not be accurate.mayankleoboy1 - Friday, November 23, 2012 - link
With each review, Samsung 840Pro looks better and better.JellyRoll - Friday, November 23, 2012 - link
This information has been already hashed over by several sites, in particular TweakTown. They have been educating the public for months about the lack of TRIM with Sandforce SSDs.Other sites have also noticed the read degradation, and commented on it ad nauseum.