The 2011 Mid-Range SSD Roundup: 120GB Agility 3, Intel 510 and More Compared
by Anand Lal Shimpi on June 7, 2011 12:52 PM ESTAnandTech Storage Bench 2010
To keep things consistent we've also included our older Storage Bench. Note that the old storage test system doesn't have a SATA 6Gbps controller, so we only have one result for the 6Gbps drives.
The first in our benchmark suite is a light/typical usage case. The Windows 7 system is loaded with Firefox, Office 2007 and Adobe Reader among other applications. With Firefox we browse web pages like Facebook, AnandTech, Digg and other sites. Outlook is also running and we use it to check emails, create and send a message with a PDF attachment. Adobe Reader is used to view some PDFs. Excel 2007 is used to create a spreadsheet, graphs and save the document. The same goes for Word 2007. We open and step through a presentation in PowerPoint 2007 received as an email attachment before saving it to the desktop. Finally we watch a bit of a Firefly episode in Windows Media Player 11.
There’s some level of multitasking going on here but it’s not unreasonable by any means. Generally the application tasks proceed linearly, with the exception of things like web browsing which may happen in between one of the other tasks.
The recording is played back on all of our drives here today. Remember that we’re isolating disk performance, all we’re doing is playing back every single disk access that happened in that ~5 minute period of usage. The light workload is composed of 37,501 reads and 20,268 writes. Over 30% of the IOs are 4KB, 11% are 16KB, 22% are 32KB and approximately 13% are 64KB in size. Less than 30% of the operations are absolutely sequential in nature. Average queue depth is 6.09 IOs.
The performance results are reported in average I/O Operations per Second (IOPS):
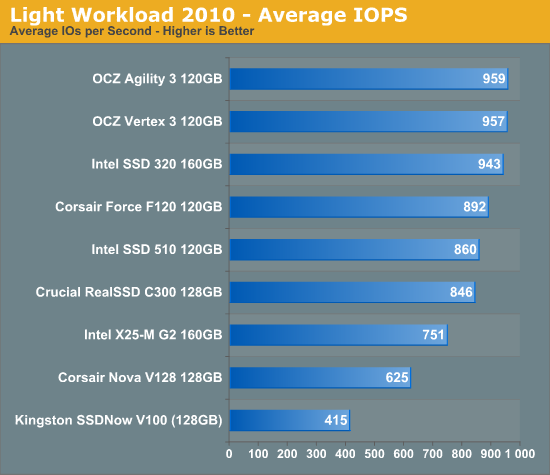
Our old light workload from 2010 highlights an important point about all of these SSDs. For light usage, in a completely IO bound workload, there's only a 13% difference in performance between the fastest 6Gbps drive and last year's C300. If there's only a 13% difference in this completely IO bound test, the real world difference will surely be nonexistent.
If there’s a light usage case there’s bound to be a heavy one. In this test we have Microsoft Security Essentials running in the background with real time virus scanning enabled. We also perform a quick scan in the middle of the test. Firefox, Outlook, Excel, Word and Powerpoint are all used the same as they were in the light test. We add Photoshop CS4 to the mix, opening a bunch of 12MP images, editing them, then saving them as highly compressed JPGs for web publishing. Windows 7’s picture viewer is used to view a bunch of pictures on the hard drive. We use 7-zip to create and extract .7z archives. Downloading is also prominently featured in our heavy test; we download large files from the Internet during portions of the benchmark, as well as use uTorrent to grab a couple of torrents. Some of the applications in use are installed during the benchmark, Windows updates are also installed. Towards the end of the test we launch World of Warcraft, play for a few minutes, then delete the folder. This test also takes into account all of the disk accesses that happen while the OS is booting.
The benchmark is 22 minutes long and it consists of 128,895 read operations and 72,411 write operations. Roughly 44% of all IOs were sequential. Approximately 30% of all accesses were 4KB in size, 12% were 16KB in size, 14% were 32KB and 20% were 64KB. Average queue depth was 3.59.
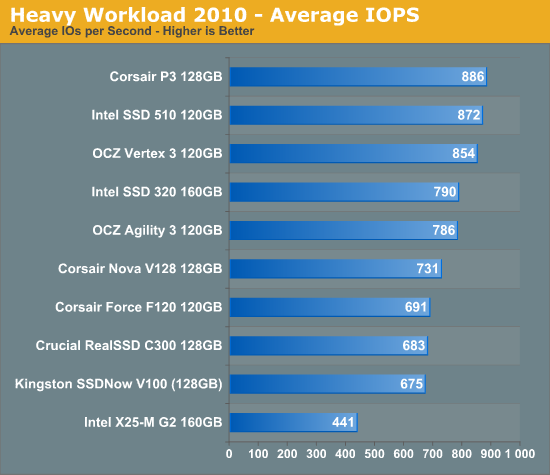
Our heavy workload is really no different in terms of the performance spread. All of the newer drives show very similar performance.
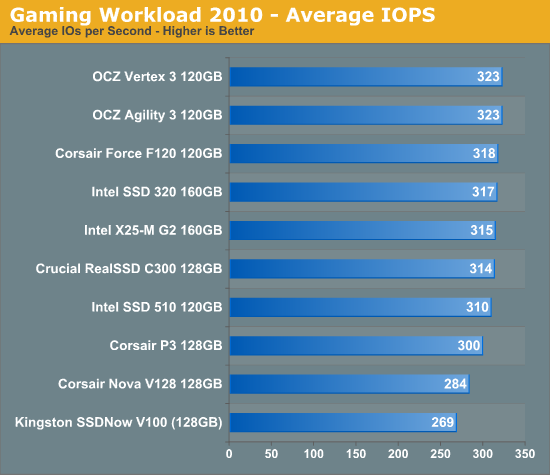
The gaming workload is made up of 75,206 read operations and only 4,592 write operations. Only 20% of the accesses are 4KB in size, nearly 40% are 64KB and 20% are 32KB. A whopping 69% of the IOs are sequential, meaning this is predominantly a sequential read benchmark. The average queue depth is 7.76 IOs.


68 Comments
View All Comments
johan851 - Tuesday, June 7, 2011 - link
I've been wanting a comparison like this for a couple of weeks now, and I'm really glad you provided one. Thanks!Oxford Guy - Thursday, June 9, 2011 - link
Now if we could get a review with the 240 GB Vertex 2.That has been as low as $309 AR at MicroCenter. Yet, despite being able to be found for low prices ($350 AR lately), it's still nowhere to be found in reviews here.
shamans33 - Tuesday, June 7, 2011 - link
I just bought one for $220 before a $20 MIR about 2 weeks ago.Furthermore, your OCZ Agility 3 price is more expensive than the OCZ Vertex 3 price.....
Might want to look into getting pricing from a variety of vendors.
Anand Lal Shimpi - Tuesday, June 7, 2011 - link
Updated :)aegisofrime - Tuesday, June 7, 2011 - link
You updated the price but not the price per GB. :pI haven't had time to read through the whole article as I have to sleep now, so forgive me if my following question was addressed in the article. I'm considering a 120GB Intel 320, and I'm wondering will performance be lower than the 160GB version?
cactusdog - Wednesday, June 8, 2011 - link
Why no Corsair force 3 drives? Or mushkin ChronosFallen Kell - Wednesday, June 8, 2011 - link
They were all just recalled, that is why.http://forum.corsair.com/v3/showthread.php?t=95825
Shadowmaster625 - Tuesday, June 7, 2011 - link
No wonder intel was in no hurry with sata6. Half a watt extra power consumption at idle? Will that be the same for notebooks and tablets? If so then that is a serious problem. Why would power consumption be different at idle anyway?imaheadcase - Tuesday, June 7, 2011 - link
I read sometime back that intel drives performance might suffer simply because of power issues itself. Nothing bad mind you, just that its standby mode interferes with transferring data somewhat. Not sure if thats a firmware or just config error.Jaybus - Friday, June 10, 2011 - link
Because, even though sata6 has improved power management, the higher clock rate simply requires more power. Even at idle, there has to be some communication between the SSD and the SATA host controller. Primarily, it is up to the OS to put the SATA link into sleep mode. In general, sata6 will always use more power than sata3, since you can't get around the physics. Clocking faster requires either more power or a complete paradigm shift to an optical PHY.