Super Talent & TEAM Join the Fast DDR2 Club
by Wesley Fink on October 10, 2006 4:00 AM EST- Posted in
- Memory
Performance Comparison
While Sandra and Super Pi provide useful information on how memory performs, the real test is real-world benchmarks - specifically gaming benchmarks. We use Far Cry, Half-Life 2 and Quake 4 for memory testing because they are sensitive to memory changes, making them useful for examining memory performance.
Since the results were so close at all tested speeds, the scale range was reduced to better show the small differences in these memories. Please keep this in mind when viewing the charts, since a normal zero scale would make performance differences appear much smaller than these expanded scale charts. Values for each memory at each speed are included below each chart for reference.
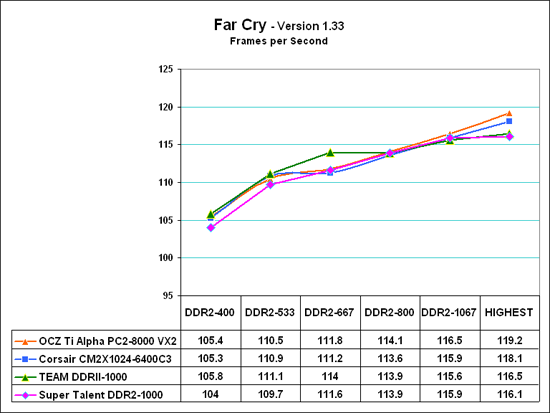
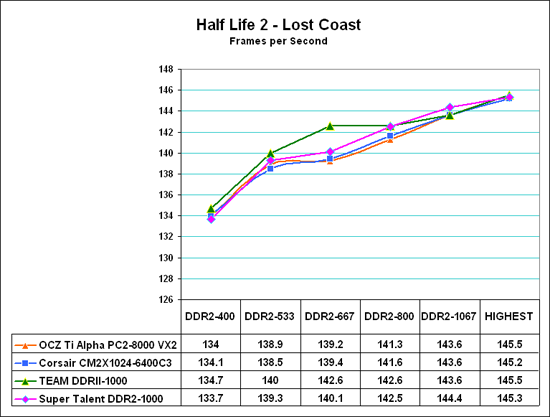
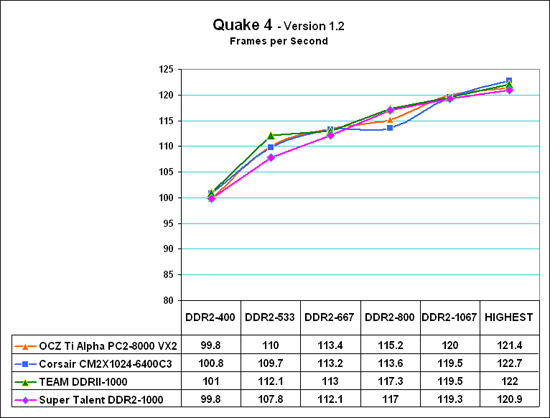
All three games continue to show improvement in frame rates as memory speed increases, even though timings are looser the faster we go. Put another way, performance continues to improve as memory speed increases - to DDR2-1067 and a bit beyond. The TEAM is still capable of operating at 4-3-4 timings at DDR2-1067, and the Super Talent is only a bit slower at 4-3-5 timings. At the bottom of the scaling chart Super Talent requires a 3 RAS-to-CAS setting, while the other 3 memories are stable at a 2 setting. This is reflected in the general drop-off at the bottom and top for Super Talent, while the TEAM memory mirrors the results of the OCS and Corsair. The performance differences are admittedly very small - but still measurable. Memory speed can definitely improve system performance, but not to the extent of an upgraded video card or a higher speed processor.
While Sandra and Super Pi provide useful information on how memory performs, the real test is real-world benchmarks - specifically gaming benchmarks. We use Far Cry, Half-Life 2 and Quake 4 for memory testing because they are sensitive to memory changes, making them useful for examining memory performance.
Since the results were so close at all tested speeds, the scale range was reduced to better show the small differences in these memories. Please keep this in mind when viewing the charts, since a normal zero scale would make performance differences appear much smaller than these expanded scale charts. Values for each memory at each speed are included below each chart for reference.
All three games continue to show improvement in frame rates as memory speed increases, even though timings are looser the faster we go. Put another way, performance continues to improve as memory speed increases - to DDR2-1067 and a bit beyond. The TEAM is still capable of operating at 4-3-4 timings at DDR2-1067, and the Super Talent is only a bit slower at 4-3-5 timings. At the bottom of the scaling chart Super Talent requires a 3 RAS-to-CAS setting, while the other 3 memories are stable at a 2 setting. This is reflected in the general drop-off at the bottom and top for Super Talent, while the TEAM memory mirrors the results of the OCS and Corsair. The performance differences are admittedly very small - but still measurable. Memory speed can definitely improve system performance, but not to the extent of an upgraded video card or a higher speed processor.


16 Comments
View All Comments
PeteRoy - Tuesday, October 10, 2006 - link
Anandtech you should really stop using these graphs, their a pain to read.Wesley Fink - Tuesday, October 10, 2006 - link
Would you prefer the bar graphs like we used in past memory reviews? If so, let us know.imaheadcase - Tuesday, October 10, 2006 - link
Yes stop using these graphs. Whats the point of putting squiqly lines on a graph if the performance is pretty close to equal on memory tests you can't notice a diffrence visually? It would be diffrence if your comparing perfomance based on early computers to the latest computer..you could see a change.Stick to the bars plus numbers graphs please.
Frumious1 - Tuesday, October 10, 2006 - link
You people are friggin morons! "Oh noes! We can't read the graph! Please make a goddamn huge ass page with EIGHTEEN graphs instead of three useful charts!" They even give you the numbers at the bottom - is it THAT HARD!?!? Well, for you two, probably, but PLEASE AnandTech, stick with charts like this where it makes sense.Allow me to demonstrate how much less desirable separating the data would be, by using as an example Half-Life 2: Lost Cost. Here you go, all 6 settings put into in-duh-vidual charts:
http://i115.photobucket.com/albums/n284/frumious1/...">DDR2-400
http://i115.photobucket.com/albums/n284/frumious1/...">DDR2-533
http://i115.photobucket.com/albums/n284/frumious1/...">DDR2-667
http://i115.photobucket.com/albums/n284/frumious1/...">DDR2-800
http://i115.photobucket.com/albums/n284/frumious1/...">DDR2-1067
http://i115.photobucket.com/albums/n284/frumious1/...">Maximum Performance (OC)
Isn't that GREAT!? I mean, now we can't easily see how performance is affected going from DDR2-400 to 533 to 667, etc. If you want to whine about non-zero-based charts, whatever. Mine are zero-based, and as you can see there's not a whole hell of a lot of difference past DDR2-800. In fact, there's not much of a difference from DDR2-400 through maximum OC performance... 8.8% more performance from minimum (Super Talent DDR2-400) to maximum (OCZ/Team Highest). Great!
Know what? ALL OF THAT DATA WAS ALREADY CLEARLY VISIBLE IN ONE CHART!
Please, go back to junior high and retake some of those math classes, because clearly they didn't stick.
theprodigalrebel - Tuesday, October 10, 2006 - link
I see nothing wrong with the graphs in this article. For instance, I see a green line (TEAM) stand out at DDR2-667 for the first two tests & stand out again at DDR2-533 in Q4. It is more or less tied with the others. This is useful information. I don't care about 1-3% differences (which could very well be nominal variance) - that means, just buy whatever is cheaper.Why would I need bar graphs that detail performance variances as tiny as .16 frames per second?
imaheadcase - Tuesday, October 10, 2006 - link
Most people would rather glance and pure numbers than any graphs. You would take LESS space than what they use now.Shortass - Tuesday, October 10, 2006 - link
Well the graphs are certainly a little harder to read than large bar graphs, but I enjoy them more since it compresses a lot of information into a smaller space and you can see on one graph the entire set of tests (easier comparison and taking a few extra seconds to read the data is much better than scrolling down a massive page trying to remember the numbers each scored at different speeds, etc).Guuts - Tuesday, October 10, 2006 - link
It would be nice if you could include some "value" RAM in with these performance RAM reviews for comparison. Instead of just talking about how you need to use fairly decent timings if you want to run the modules at 1067 to see a performance advantage, why don't you add in some actual value DDR2-800 RAM that maybe can only run 5-5-5 @ 1067 and 4-3-4 @ 800 (or whatever they can do these days) so we can see just how much performance we're going to lose if we want to save 100$ on RAM? Just how much performance is lost by having looser timings at the same speed?I love performance parts, and want the best components I can afford, but I can't justify paying 50% more for a 5% increase in performance (or +5 FPS) that I'm never going to even be able to notice in real-world use. Note that I said that *I'M* not going to notice, before you start flaming me...
Good article though!
deathwalker - Tuesday, October 10, 2006 - link
Careful guy...there are flaming hound-dogs just lurking around out there waiting for value minded people like you and I. But in defense of the article it was not created with the intent to satisfy that niche. Check out this AT article for some value ram suggestions..http://www.anandtech.com/mb/showdoc.aspx?i=2797">http://www.anandtech.com/mb/showdoc.aspx?i=2797Guuts - Tuesday, October 10, 2006 - link
Yes, thanks, I've read that one... increasing the voltage and loosening tbe timings on DDR2-667 is a little TOO value. I was basically asking what one could do with some value DDR2-800 running at 1067 and how much of a performance hit would be incurred by the loose timings you'd have to use, or even the performance of value DDR2-800 with 4-4-4 timings.Sure that article shows what you could do with that Value RAM as far as pushing the speed and tweaking the timings, but I don't see any performance numbers, nor any comparisons between different timings at the same speeds...which seems pretty important since the price of memory starts to really climb the tighter the timings are at a certain speed. I'd just like to know how much performance one loses between 3-3-3, 4-4-4, and 5-5-5 with DDR2-800, for example, because I sure know how much the price difference is.
I can see the small difference in the TEAM memory vs. the slightly looser timed Super Talent memory, but I can't remember ever reading about the performance differences between more widely varied timings and was curious to see just how much of a hit it makes on the new Core 2 Duo platforms...especially with memory prices what they are today, and 2GB kits seemingly being the recommended "standard" configuration in new systems.