The MSI MEG X399 Creation Motherboard Review: The New 16-Phase Shark In Town
by Gavin Bonshor on August 13, 2018 8:59 AM EST- Posted in
- Motherboards
- Gaming
- AMD
- MSI
- Overclocking
- ThreadRipper
- X399
- TR4
- Threadripper 2
CPU Performance, Short Form
For our motherboard reviews, we use our short form testing method. These tests usually focus on if a motherboard is using MultiCore Turbo (the feature used to have maximum turbo on at all times, giving a frequency advantage), or if there are slight gains to be had from tweaking the firmware. We put the memory settings at the CPU manufacturers suggested frequency, making it very easy to see which motherboards have MCT enabled by default.
3D Movement Algorithm Test v2.1: link 3DPM is a self-penned benchmark, taking basic 3D movement algorithms used in Brownian Motion simulations and testing them for speed. High floating point performance, MHz and IPC wins in the single thread version, whereas the multithread version has to handle the threads and loves more cores. For a brief explanation of the platform agnostic coding behind this benchmark, see my forum post here. We are using the latest version of 3DPM, which has a significant number of tweaks over the original version to avoid issues with cache management and speeding up some of the algorithms.
Rendering - LuxMark v3.1: link
As a synthetic, LuxMark might come across as somewhat arbitrary as a renderer, given that it's mainly used to test GPUs, but it does offer both an OpenCL and a standard C++ mode. In this instance, aside from seeing the comparison in each coding mode for cores and IPC, we also get to see the difference in performance moving from a C++ based code-stack to an OpenCL one with a CPU as the main host.
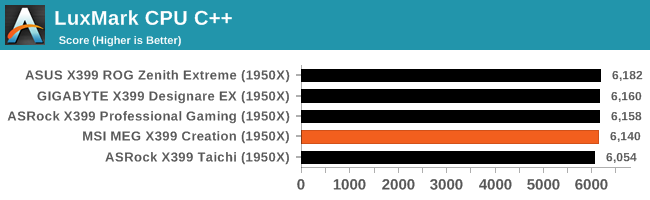
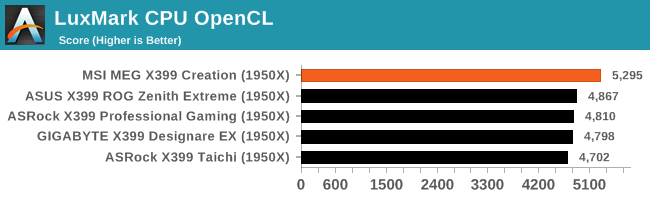
While the C++ results remain in line, the performance during the OpenCL test within LuxMark was noticeably higher. This result surprised me a bit, and I'm still not quite sure why MSI's board is ahead like it is.
Rendering - Blender 2.78: link
For a render that has been around for what seems like ages, Blender is still a highly popular tool. We managed to wrap up a standard workload into the February 5 nightly build of Blender and measure the time it takes to render the first frame of the scene. Being one of the bigger open source tools out there, it means both AMD and Intel work actively to help improve the codebase, for better or for worse on their own/each other's microarchitecture.
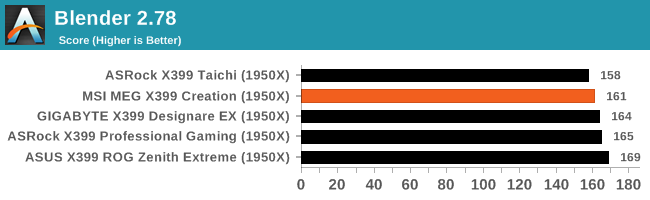
The scores outputted in our Blender 2.78 benchmark from the MSI MEG X399 Creation motherboard was one of the highest achieved so far with our Ryzen Threadripper 1950X sample, albeit just marginally better than the GIGABYTE X399 Designare EX model.
Rendering – POV-Ray 3.7.1b4: link
The Persistence of Vision Ray Tracer, or POV-Ray, is a freeware package for as the name suggests, ray tracing. It is a pure renderer, rather than modeling software, but the latest beta version contains a handy benchmark for stressing all processing threads on a platform. We have been using this test in motherboard reviews to test memory stability at various CPU speeds to good effect – if it passes the test, the IMC in the CPU is stable for a given CPU speed. As a CPU test, it runs for approximately 2-3 minutes on high end platforms. 7-Zip 9.2: link
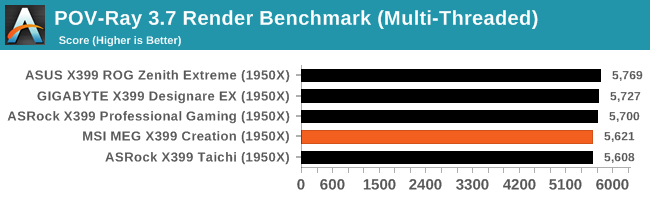
With similar scores across all of the boards tested, the MSI MEG X399 Creation outputted a similar score to the ASRock X399 Taichi, with a marginally worse score than the rest of the pack.
Synthetic – 7-Zip 9.2: link
As an open source compression tool, 7-Zip is a popular tool for making sets of files easier to handle and transfer. The software offers up its own benchmark, to which we report the result.
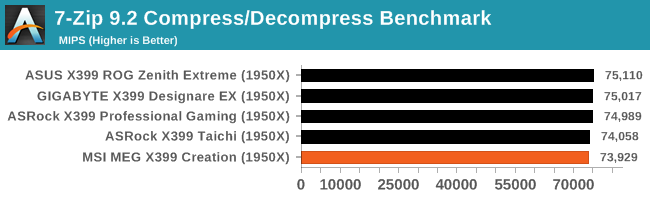
7-Zip performance focuses on compressing and decompressing data and the MSI X399 Creation displayed a score slightly off the mark in comparison to other X399 boards reviewed. While not a major concern, the score given was rather close to the ASRock X399 Taichi with around 100 points in score separating the two boards.
Neuron Simulation - DigiCortex v1.20: link
The newest benchmark in our suite is DigiCortex, a simulation of biologically plausible neural network circuits, and simulates activity of neurons and synapses. DigiCortex relies heavily on a mix of DRAM speed and computational throughput, indicating that systems which apply memory profiles properly should benefit and those that play fast and loose with overclocking settings might get some extra speed up. Results are taken during the steady state period in a 32k neuron simulation, and represented as a function of the ability to simulate in real time (1.000x equals real-time).
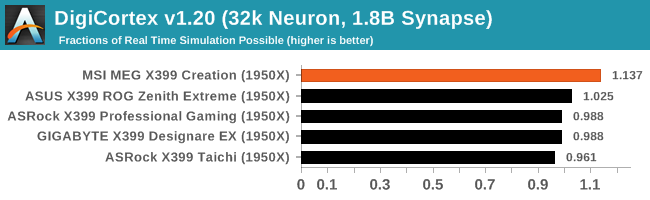
The higher score given in DigiCortex is most probably a result of a switch in RAM modules. Although we've taken measures to make the computational and memory based area of the test bench consistent with the previous X399 test bench, the increase is likely to come from better performing Samsung B-die memory ICs whereas the previous Corsair modules I suspect were using Hynix based ICs in a different chip configuration.


17 Comments
View All Comments
Chaitanya - Monday, August 13, 2018 - link
Even on high end there are no proper heatsinks for vrms its that silly solid chunks of aluminium with minimal fin stack that dominates. It was refreshing to see Gigabyte go back to old school finned heatsinks for their X470 board.Questor - Monday, August 13, 2018 - link
Flash over substance. It's a pitiful way to make a product.Oxford Guy - Wednesday, August 15, 2018 - link
Not to mention it looks worse than aluminum or copper fins.Oxford Guy - Wednesday, August 15, 2018 - link
ASUS and Gigabyte released VRM coolers back in 2013 that would be used with water systems as well as air (hybrids). This was for quad core non-prosumer CPUs, too. But, we have certainly progressed as an industry. Now, we can have really cool paint and LEDs instead of efficient VRM cooling.Questor - Monday, August 13, 2018 - link
Hopefully Buildzoid will get a hold of this model motherboard and verify it is what MSI says it is. I'm so tired of marketing lying about computer components, I don't believe much of what I read from the makers. Thus I am in "prove it" mode. Unfortunately, most reviewers either don't look or don't know what they see if they do.Ian Cutress - Monday, August 13, 2018 - link
This is one of the reasons we have our power delivery component table in our reviews now. Gavin knows what he's talking about - he did a good deconstruction of the B450 boards that exhibit the behaviour you are describing.https://www.anandtech.com/show/13085/the-asrock-b4...
Gothmoth - Monday, August 13, 2018 - link
it´s an 8 phase. as 2 "phases" are always in phase and therfore can not count as two seperate phases.one is marekting the other is reality.
diehardmacfan - Monday, August 13, 2018 - link
mmm no this looks like an actual 16 phase, just a "dumb" 16 phase because of the doublers.the cooling looks pretty crappy though.
KateH - Sunday, August 19, 2018 - link
i looked up the datasheet for the doublers mentioned and it describes them as outputting 2 PWM signals 180* apart so functionally its rectifying 16 phases, but the regulator sees 8.KateH - Sunday, August 19, 2018 - link
the datasheet if anyone is interested:https://www.infineon.com/dgdl/ir3599.pdf?fileId=55...
neat trick, and according to the sheet the doublers can also function as quadruplers so if one wanted 32 phases for some insane reason they could do that with the 8-channel controllers