The Intel Broadwell Xeon E3 v4 Review: 95W, 65W and 35W with eDRAM
by Ian Cutress on August 26, 2015 9:00 AM ESTGaming Benchmarks: Mid-Range
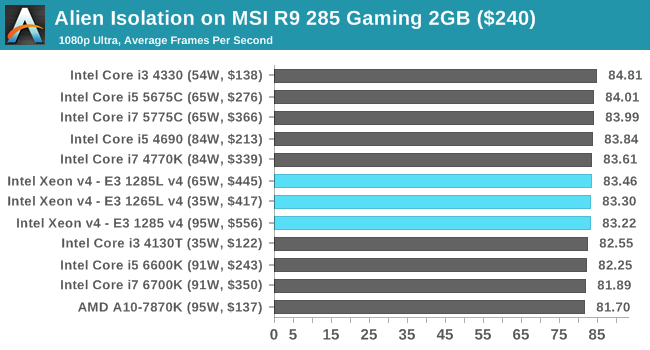
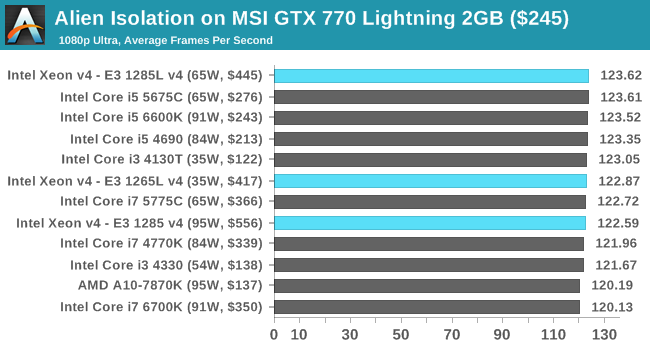
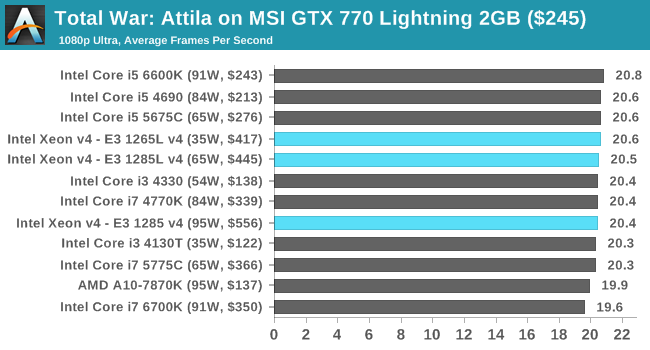
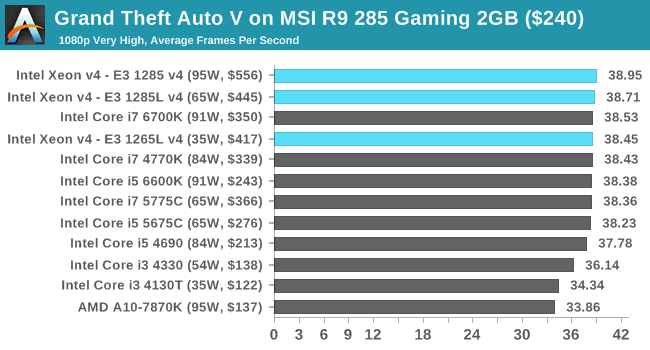
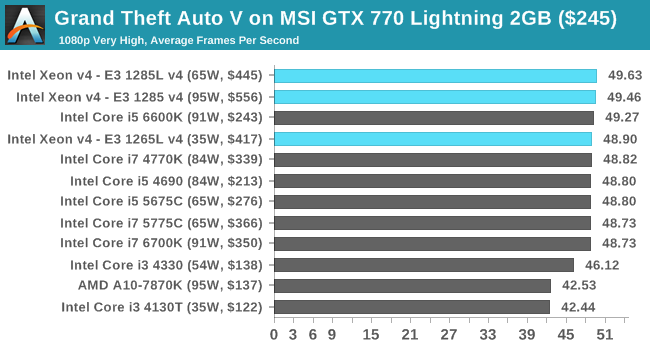
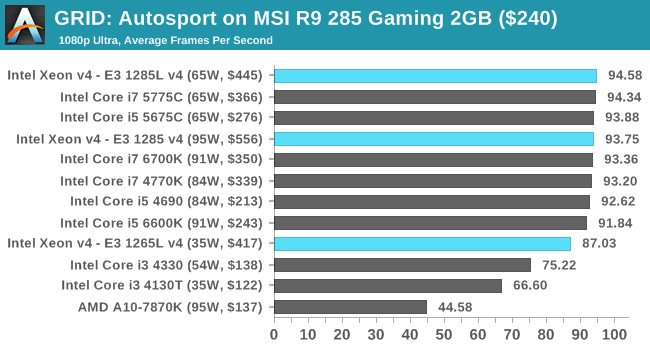
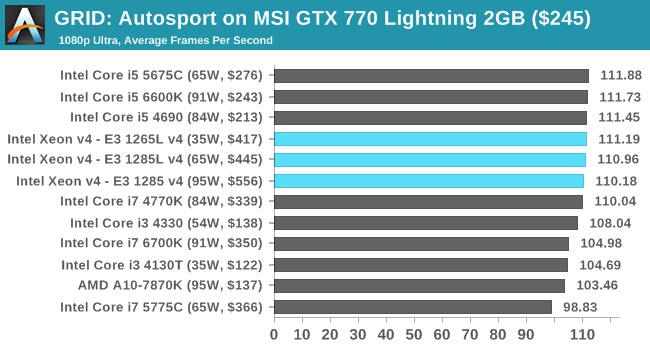
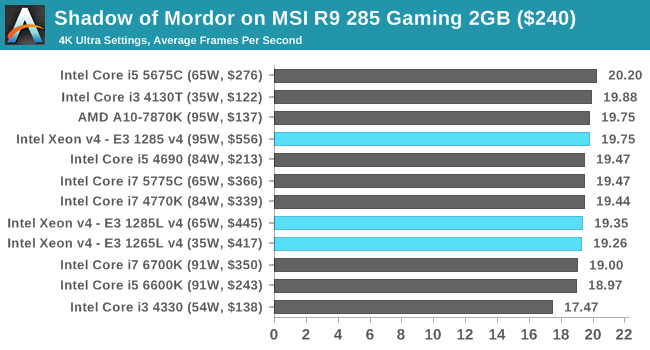
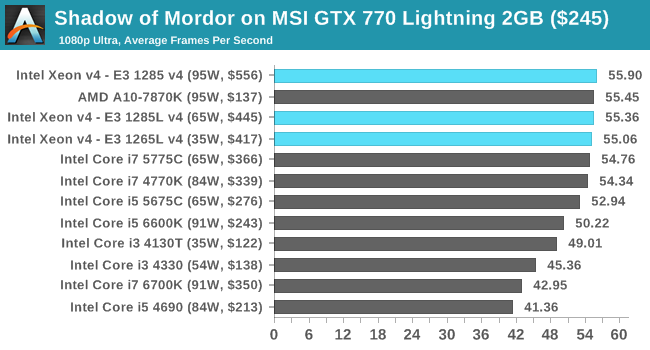
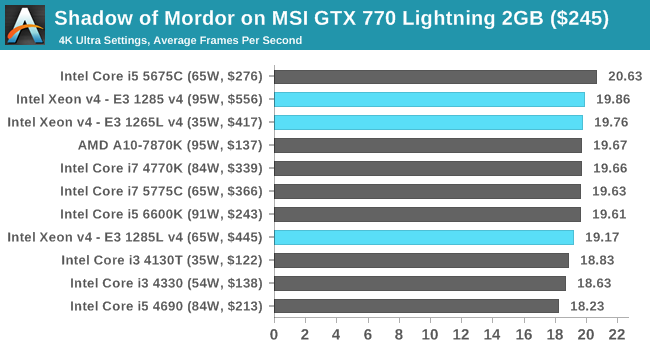
To satisfy our curiosity regarding high power and low power eDRAM based Xeons in gaming, we ran our regular suite through each processor. On this page are our results with a mid-range card, the R9 285, and an ex-high end card, the GTX 770 (a GTX 680 rebadge).
Alien: Isolation
If first person survival mixed with horror is your sort of thing, then Alien: Isolation, based off of the Alien franchise, should be an interesting title. Developed by The Creative Assembly and released in October 2014, Alien: Isolation has won numerous awards from Game Of The Year to several top 10s/25s and Best Horror titles, ratcheting up over a million sales by February 2015. Alien: Isolation uses a custom built engine which includes dynamic sound effects and should be fully multi-core enabled.
For low end graphics, we test at 720p with Ultra settings, whereas for mid and high range graphics we bump this up to 1080p, taking the average frame rate as our marker with a scripted version of the built-in benchmark.
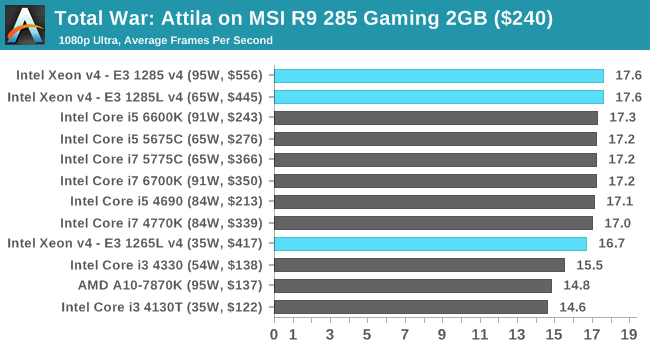
Total War: Attila
The Total War franchise moves on to Attila, another The Creative Assembly development, and is a stand-alone strategy title set in 395AD where the main story line lets the gamer take control of the leader of the Huns in order to conquer parts of the world. Graphically the game can render hundreds/thousands of units on screen at once, all with their individual actions and can put some of the big cards to task.
For low end graphics, we test at 720p with performance settings, recording the average frame rate. With mid and high range graphics, we test at 1080p with the quality setting. In both circumstances, unlimited video memory is enabled and the in-game scripted benchmark is used.

Grand Theft Auto V
The highly anticipated iteration of the Grand Theft Auto franchise finally hit the shelves on April 14th 2015, with both AMD and NVIDIA in tow to help optimize the title. GTA doesn’t provide graphical presets, but opens up the options to users and extends the boundaries by pushing even the hardest systems to the limit using Rockstar’s Advanced Game Engine. Whether the user is flying high in the mountains with long draw distances or dealing with assorted trash in the city, when cranked up to maximum it creates stunning visuals but hard work for both the CPU and the GPU.
For our test we have scripted a version of the in-game benchmark, relying only on the final part which combines a flight scene along with an in-city drive-by followed by a tanker explosion. For low end systems we test at 720p on the lowest settings, whereas mid and high end graphics play at 1080p with very high settings across the board. We record both the average frame rate and the percentage of frames under 60 FPS (16.6ms).

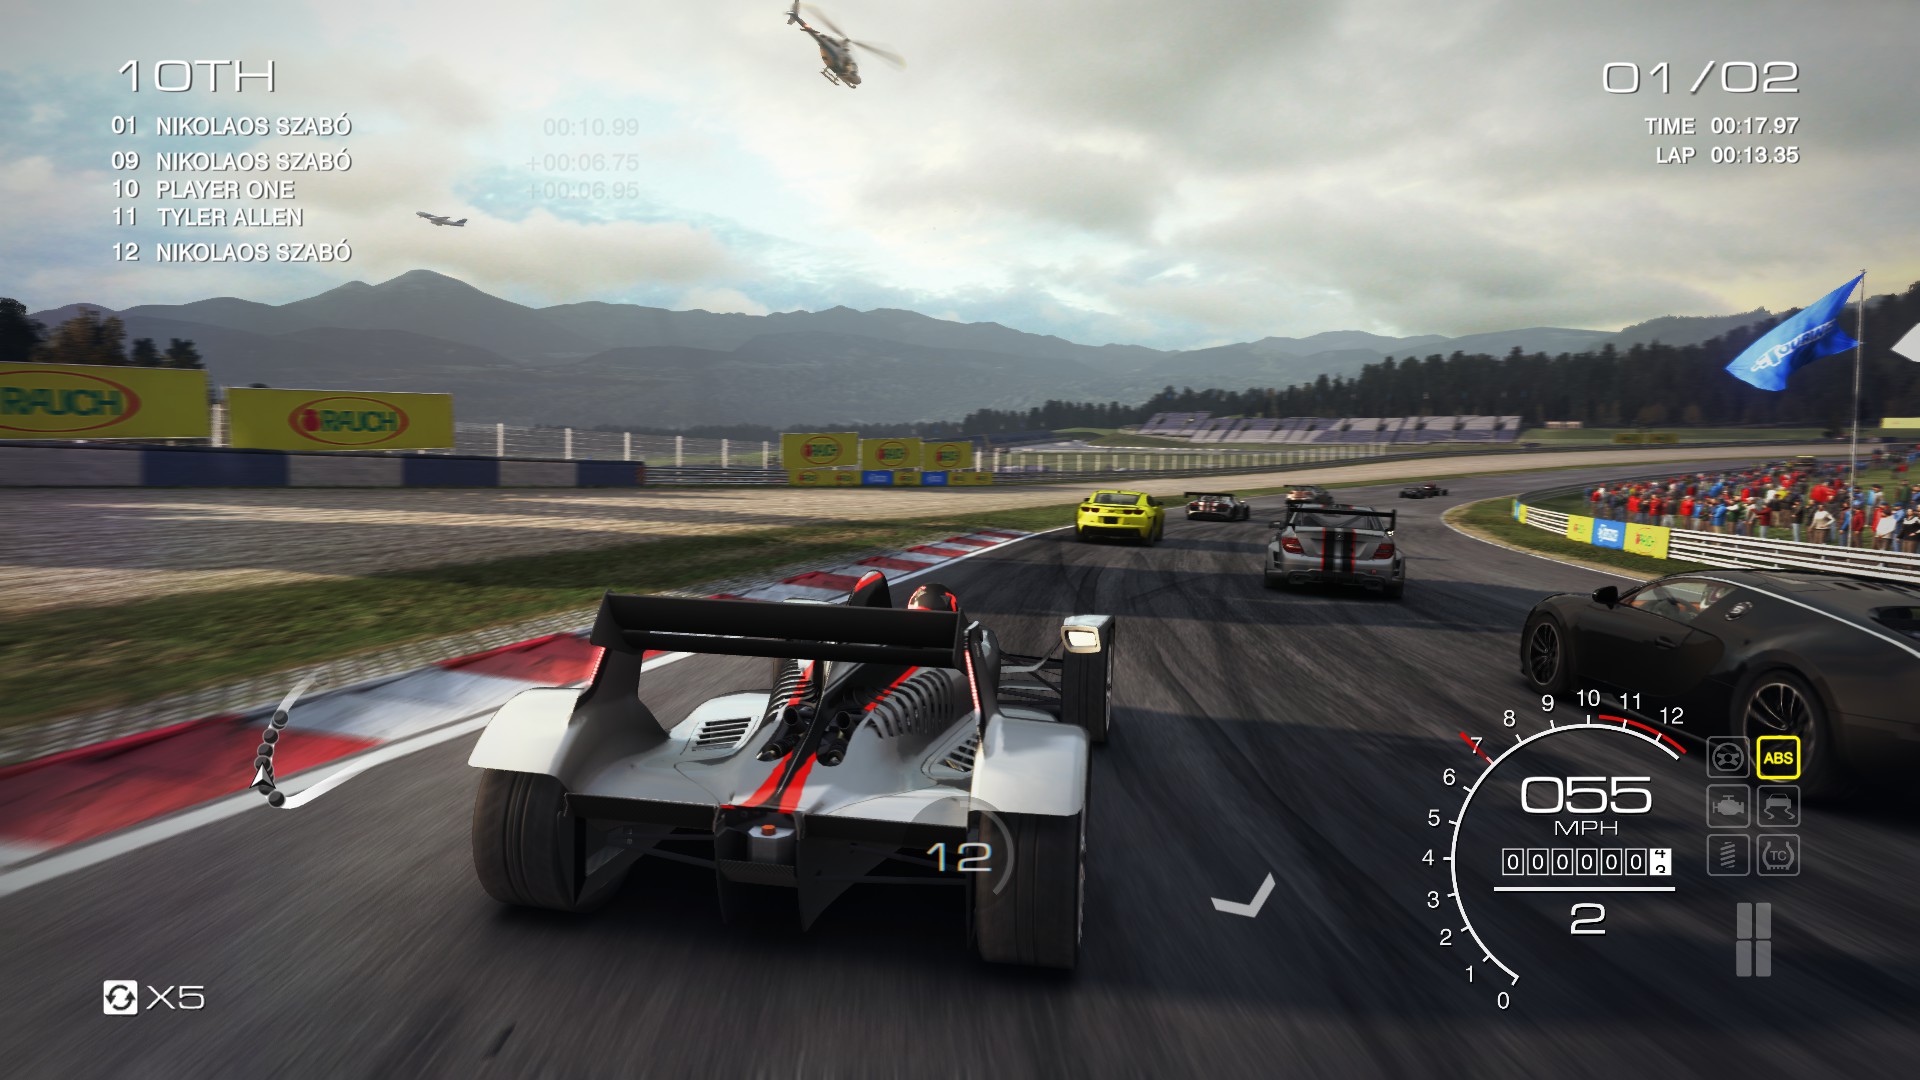
GRID: Autosport
No graphics tests are complete without some input from Codemasters and the EGO engine, which means for this round of testing we point towards GRID: Autosport, the next iteration in the GRID and racing genre. As with our previous racing testing, each update to the engine aims to add in effects, reflections, detail and realism, with Codemasters making ‘authenticity’ a main focal point for this version.
GRID’s benchmark mode is very flexible, and as a result we created a test race using a shortened version of the Red Bull Ring with twelve cars doing two laps. The car is focus starts last and is quite fast, but usually finishes second or third. For low end graphics we test at 1080p medium settings, whereas mid and high end graphics get the full 1080p maximum. Both the average and minimum frame rates are recorded.
Middle-Earth: Shadow of Mordor
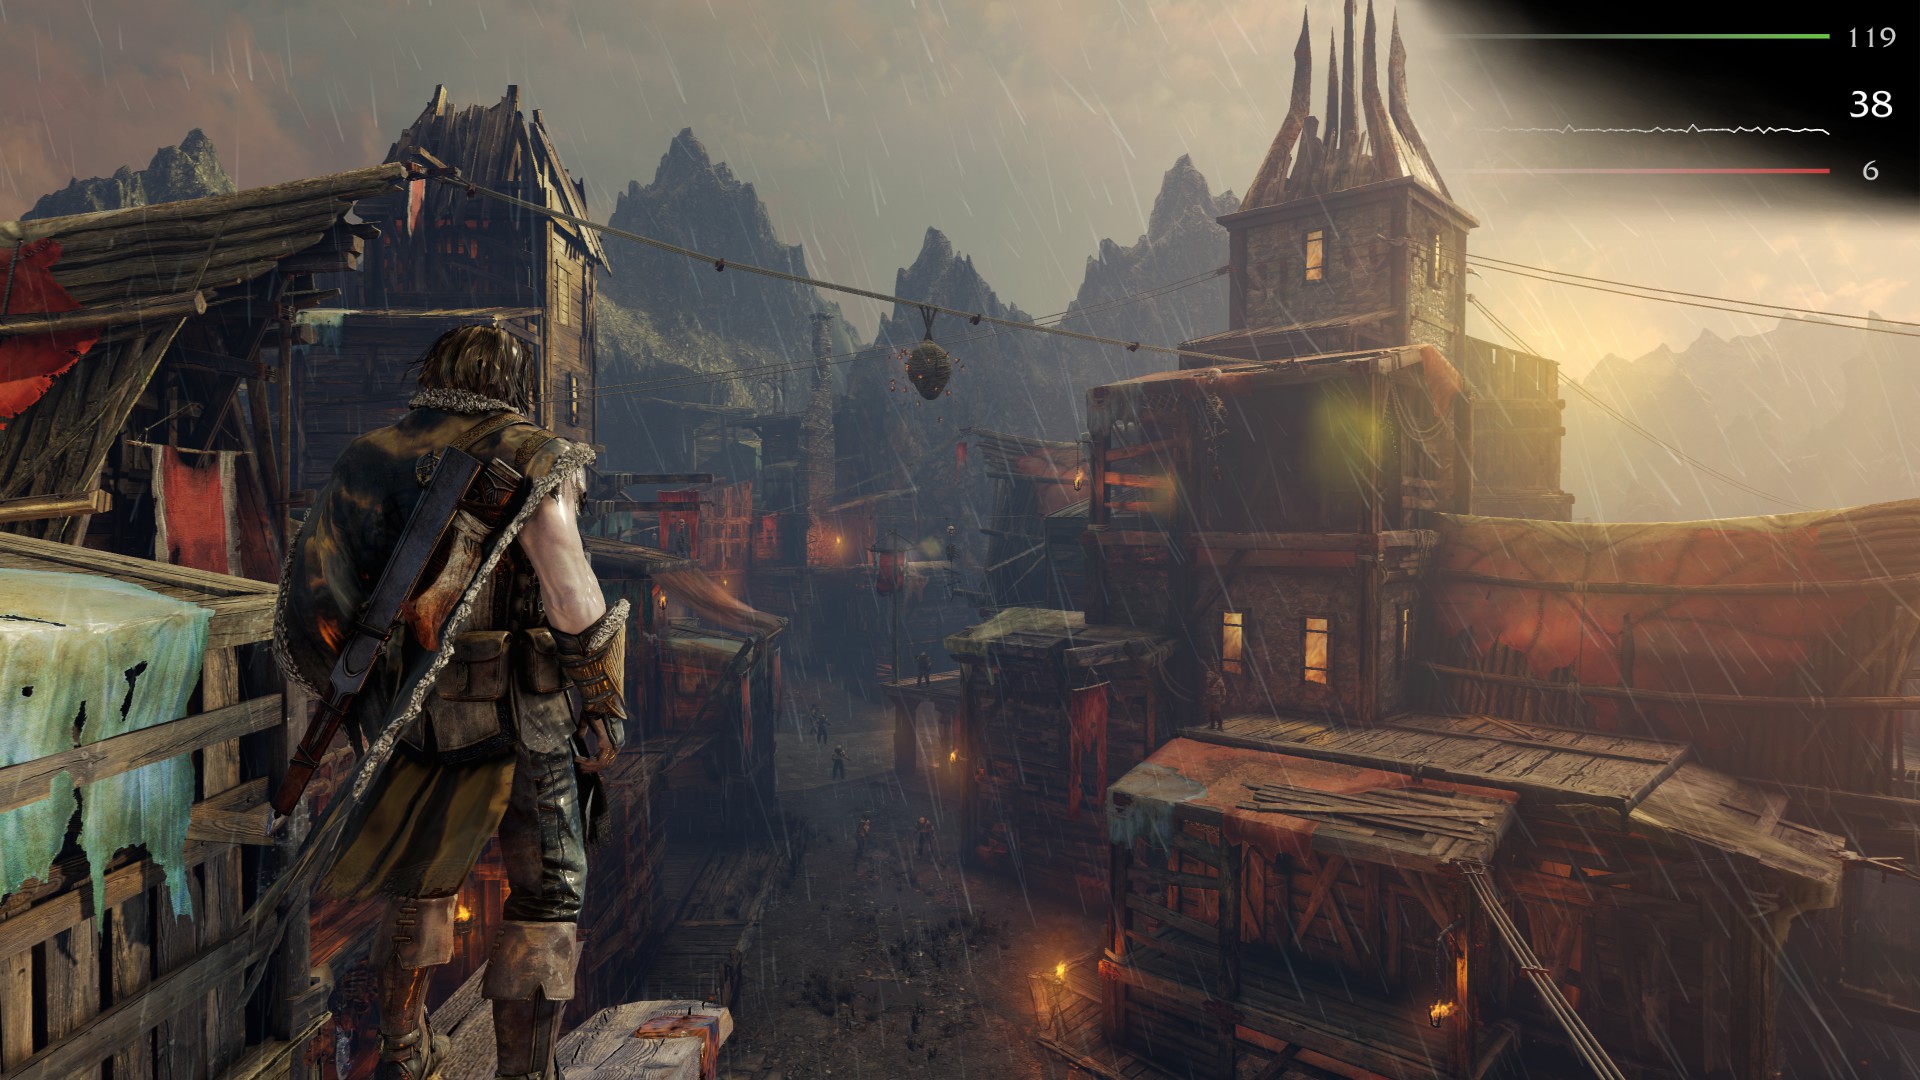
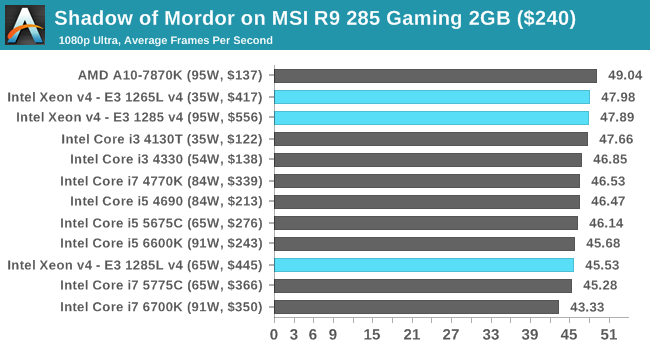
The final title in our testing is another battle of system performance with the open world action-adventure title, Shadow of Mordor. Produced by Monolith using the LithTech Jupiter EX engine and numerous detail add-ons, SoM goes for detail and complexity to a large extent, despite having to be cut down from the original plans. The main story itself was written by the same writer as Red Dead Redemption, and it received Zero Punctuation’s Game of The Year in 2014.
For testing purposes, SoM gives a dynamic screen resolution setting, allowing us to render at high resolutions that are then scaled down to the monitor. As a result, we get several tests using the in-game benchmark. For low end graphics we examine at 720p with low settings, whereas mid and high end graphics get 1080p Ultra. The top graphics test is also redone at 3840x2160, also with Ultra settings, and we also test two cards at 4K where possible.


72 Comments
View All Comments
ruthan - Thursday, August 27, 2015 - link
So pleas add some virtualization into benchmarking set.Ian Cutress - Thursday, August 27, 2015 - link
It's on the cards.Mastadon - Thursday, August 27, 2015 - link
No support for DDR4 RAM? C'mon, it's 2015.SuperVeloce - Thursday, August 27, 2015 - link
This is Broadwell, not Skylake... It's meant to introduce new litography process and updated platform, not new arhitectures and memory controllers...Oxford Guy - Thursday, August 27, 2015 - link
DDR4 isn't of much benefit, except for servers (power consumption)AnnonymousCoward - Thursday, August 27, 2015 - link
Skylake FTW. Why pay more for the slower Xeon?Oxford Guy - Thursday, August 27, 2015 - link
If you read the Skylake review here you'll find that it's not really better than Broadwell, just different.AnnonymousCoward - Thursday, August 27, 2015 - link
Dude, look at the graphs on the conclusion page of this review. Skylake beats the closest Xeon by 19% in most of them.Oxford Guy - Sunday, August 30, 2015 - link
I wasn't talking about Xeon. Look at the previous desktop review. I read your post too quickly and missed that you were talking about Xeon.joex4444 - Thursday, August 27, 2015 - link
Is it even clear that the 1285 and 1285L performed differently to a statistically significant degree? I mean if one has a benchmark performed three times and scores of, say, {1176, 1188, 1182} are obtained for the 1285 but the 1285L gets {1190, 1175, 1184} then the 1285L seems to have an average of 1183 while the 1285 has an average of 1182. But when we look at those distributions, they completely agree and show no performance difference, which given one has an extra 100MHz on it we'd expect a 1 part in 34 advantage, ie, a 2.9% performance gap with the 95W 1285 outperforming the 65W 1285L.Further, it's important to recall the first chart showing that the 95W 1285 actually used less power in the idle -> OCCT test. The TDP is not a measure of how much power the CPU uses, plain and simple. It's a specification stating the maximum amount of power that can be dissipated in the form of heat. Therefore when the author states "100MHz does not adequately explain 30W in the grand scheme of things" they're exactly correct about the TDP, but it comes off suggesting one actually *uses* 30W more than the other which is simply not true. It does sound pretty clear that either (a) Intel bins their TDPs and the 3.5GHz one bumped up past the 65W bin or (b) Intel uses better parts for the 1285L, but this does not explain why it would cost $100-ish (~18%) less as we would expect better parts to be scarcer not more abundant.
As far as binned TDPs go, we know they do this. Look at the 84W parts. They don't all use 84W, they're just all rated as capable of dissipating up to 84W. Further we don't see arbitrary TDPs, we see a few, eg, 35W, 65W, 84W, 95W, 125W, and if you're AMD, 220W.