The Intel Broadwell Review Part 2: Overclocking, IPC and Generational Analysis
by Ian Cutress on August 3, 2015 8:00 AM ESTProfessional Performance: Windows
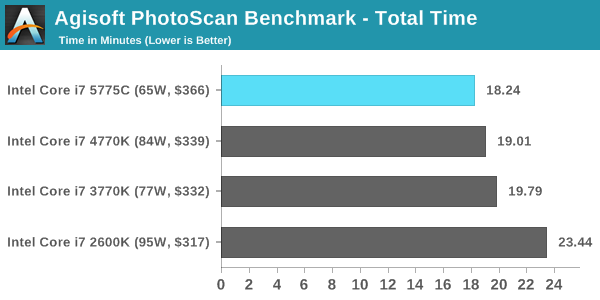
Agisoft Photoscan – 2D to 3D Image Manipulation: link
Agisoft Photoscan creates 3D models from 2D images, a process which is very computationally expensive. The algorithm is split into four distinct phases, and different phases of the model reconstruction require either fast memory, fast IPC, more cores, or even OpenCL compute devices to hand. Agisoft supplied us with a special version of the software to script the process, where we take 50 images of a stately home and convert it into a medium quality model. This benchmark typically takes around 15-20 minutes on a high end PC on the CPU alone, with GPUs reducing the time.
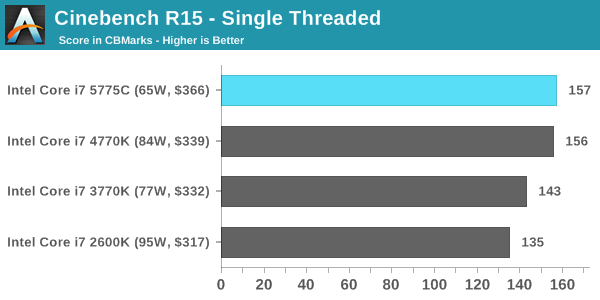
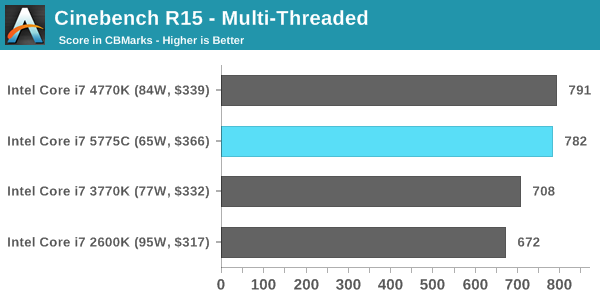
Cinebench R15
Cinebench is a benchmark based around Cinema 4D, and is fairly well known among enthusiasts for stressing the CPU for a provided workload. Results are given as a score, where higher is better.
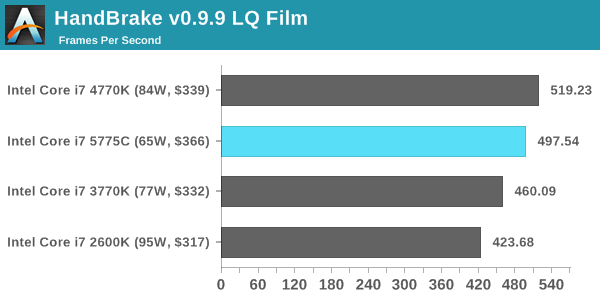
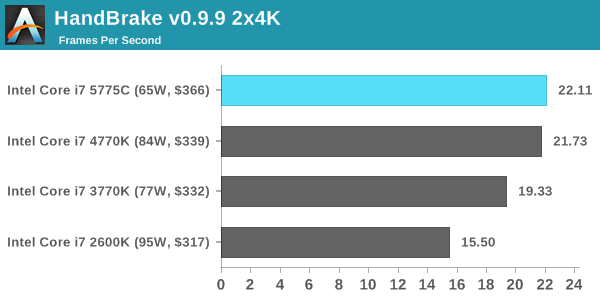
HandBrake v0.9.9: link
For HandBrake, we take two videos (a 2h20 640x266 DVD rip and a 10min double UHD 3840x4320 animation short) and convert them to x264 format in an MP4 container. Results are given in terms of the frames per second processed, and HandBrake uses as many threads as possible.
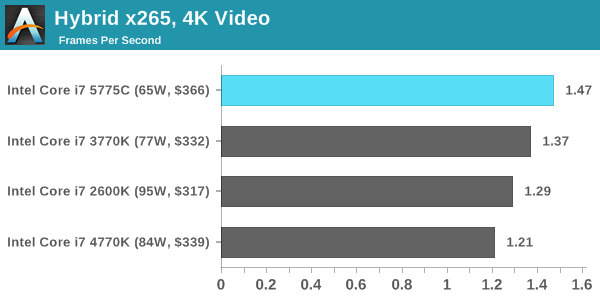
Hybrid x265
Hybrid is a new benchmark, where we take a 4K 1500 frame video and convert it into an x265 format without audio. Results are given in frames per second.


121 Comments
View All Comments
extide - Monday, August 3, 2015 - link
Actually, no the Author has it correct. The big die the che CPU/GPU, and the small one is the eDRAM.On the GT3 dies, Intel folds the graphics back across the CPU's, instead of having it as a very long rectangle.
See this: http://www.computershopper.com/var/ezwebin_site/st...
vs This: http://www.overclock.net/content/type/61/id/230657...
hansmuff - Monday, August 3, 2015 - link
Ian, Thank you for this excellent article. I have wished for a 2600k comparison to the more recent CPU iterations and one can piece some of it together here and there but this comprehensive view is outstanding! Still holding out for Skylake, then the 2600k might have to retire.Ewann - Monday, August 3, 2015 - link
I am really happy to see the i7-2600k comparison here. Like others who've commented, I'm still running that CPU- albeit at stock clock- and it's been totally stable with months on end of uptime (knock on wood). Sure, I've upgraded the GPU once or twice since 2011, but I can't see any reason to build a new system based on these benchmarks. The GPU (GTX 780) is still the limiting factor for gaming, and the 15-20% performance boost overall won't make a significant difference in my day-to-day usage. I now understand why Intel is struggling.Awesomeness - Monday, August 3, 2015 - link
Same here. I bought a 2600K in the first month it was out. After years of 24/7 operation at 4,9GHz it died. I replaced it with a $100 2500K that's running at 4,6GHz. SB for the win.nathanddrews - Monday, August 3, 2015 - link
OC benchmarks from each generation? I saw stock benchmarks and 3GHz benchmarks, but not benchmarks for Good or Great OC. I was expecting it based off of the title, but didn't see anything in the article.Staafk - Monday, August 3, 2015 - link
Missing OC performance comparisons. Or am I blind? The latter is quite possible tbh.Dribble - Monday, August 3, 2015 - link
Yes, that's what I thought. I want to see what they can all do at a good o/c. I don't run my cpu stock or at 3ghz, I want to see how my o/c sandy bridge would do against an o/c broadwell to see if it's worth an upgrade yet?Impulses - Monday, August 3, 2015 - link
You can typically extrapolate like 5% per 200MHz, tho it would've been nice to see indeed.joex4444 - Monday, August 3, 2015 - link
With the whole point of the article being that IPC goes up, this rule is really not suitable. If the IPC goes up by 20%, then if the previous generation followed the 5% per 200MHz rule the new generation follows either 6% per 200MHz or 5% per 167MHz. Though we'd really expect the instructions per second (IPS) to be the important part, and that's not dependent solely upon the size of the overclock, but the ratio of the overclock to stock. Jumping to 4.2GHz from 3.2GHz is a 31% gain, but going to 4.5GHz from 3.5GHz is a 29% gain despite both being a 1.0GHz overclock.With the typical IPC gain of 4.4%, we could roughly estimate that a Broadwell at 4.2GHz is like a Haswell at 4.4GHz. With 4.2GHz on Broadwell being a "Good OC" and 4.5GHz on Haswell being a "Good OC" we'd still expect Haswell to be faster once overclocked - but the review should be showing this. However if the particular program is making really good use of the eDRAM, then that 4.2GHz is akin to Haswell at 4.9GHz, which is beyond an excellent OC...
SirMaster - Monday, August 3, 2015 - link
Feelin' pretty good about my 4.6GHz 4770K that I bought more than 2 years ago heh.