The Intel Broadwell Review Part 2: Overclocking, IPC and Generational Analysis
by Ian Cutress on August 3, 2015 8:00 AM ESTGenerational Tests: Office and Web Benchmarks
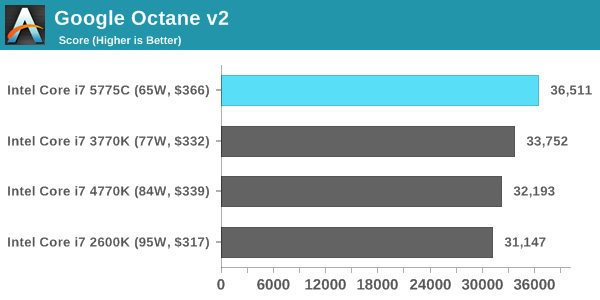
For this review, as mentioned on the front page, we retested some of the older CPUs under our new methodology. We did this testing at stock frequency as well as the IPC testing to see the ultimate real world result when you add in HyperThreading and frequency into the mix. If you recall back in our Devil’s Canyon i7-4790K review, the new high 4.4 GHz frequency of the i7-4790K was a tough one to beat for the newer architecture purely because any IPC gains are nullified by the older processor having a lot more frequency. With the Broadwell based i7-5775C being at 3.7 GHz and only 65W, this is a tough task. But what about if you are still running the Sandy Bridge based i7-2600K?
Some users will notice that in our benchmark database Bench, we keep data on the CPUs we’ve tested back over a decade and the benchmarks we were running back then. For a few of these benchmarks, such as Cinebench R10, we do actually run these on the new CPUs as well, although for the sake of brevity and relevance we tend not to put this data in the review. Well here are a few of those numbers too.
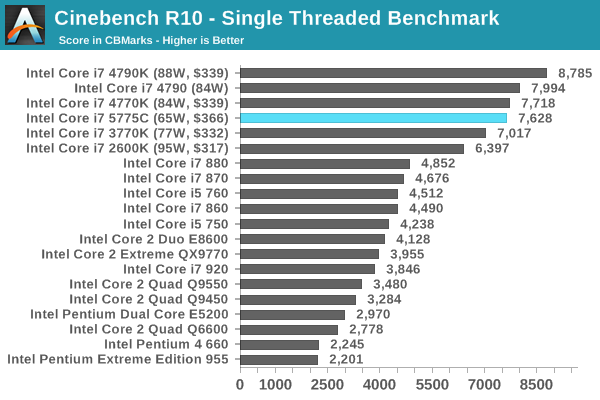
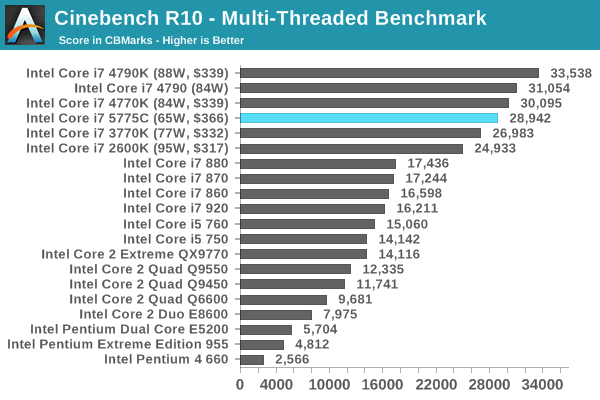
With some of these benchmarks, due to applications using new instruction sets, having the newer processors with the new instructions can make a lot of difference. Even in Cinebench R10, moving from the Core 2 Quad Q9550 to a Broadwell can get a 2.5x speed-up in this old software.
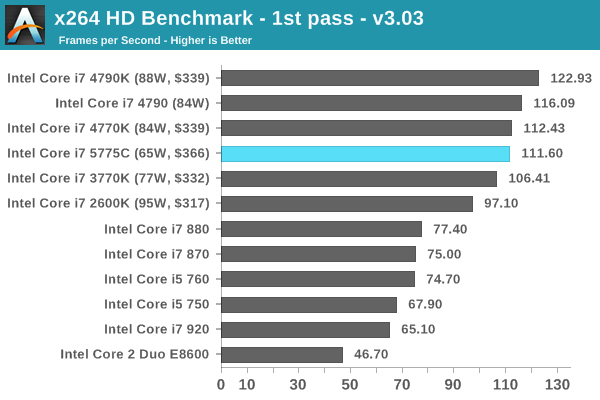
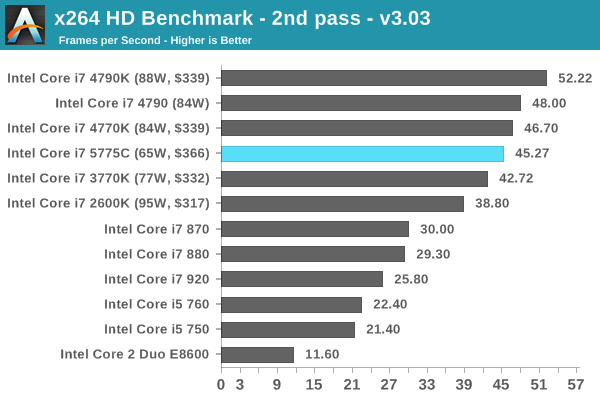
For the rest of our CPU benchmarks, here is what the landscape looks like with the most recent architectures. All of our benchmark results can also be found in our benchmark engine, Bench.
Office Performance
The dynamics of CPU Turbo modes, both Intel and AMD, can cause concern during environments with a variable threaded workload. There is also an added issue of the motherboard remaining consistent, depending on how the motherboard manufacturer wants to add in their own boosting technologies over the ones that Intel would prefer they used. In order to remain consistent, we implement an OS-level unique high performance mode on all the CPUs we test which should override any motherboard manufacturer performance mode.
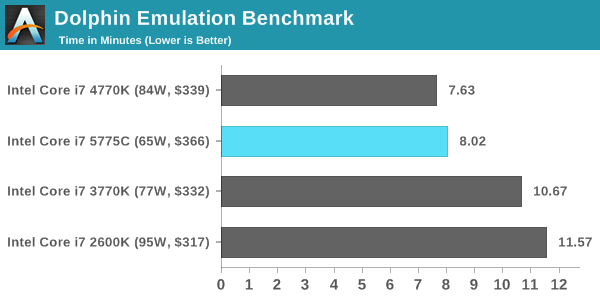
Dolphin Benchmark: link
Many emulators are often bound by single thread CPU performance, and general reports tended to suggest that Haswell provided a significant boost to emulator performance. This benchmark runs a Wii program that raytraces a complex 3D scene inside the Dolphin Wii emulator. Performance on this benchmark is a good proxy of the speed of Dolphin CPU emulation, which is an intensive single core task using most aspects of a CPU. Results are given in minutes, where the Wii itself scores 17.53 minutes.
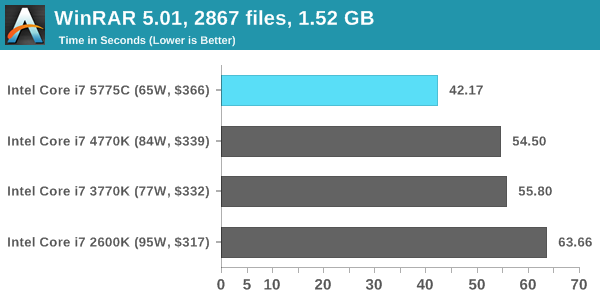
WinRAR 5.0.1: link
Our WinRAR test from 2013 is updated to the latest version of WinRAR at the start of 2014. We compress a set of 2867 files across 320 folders totaling 1.52 GB in size – 95% of these files are small typical website files, and the rest (90% of the size) are small 30 second 720p videos.
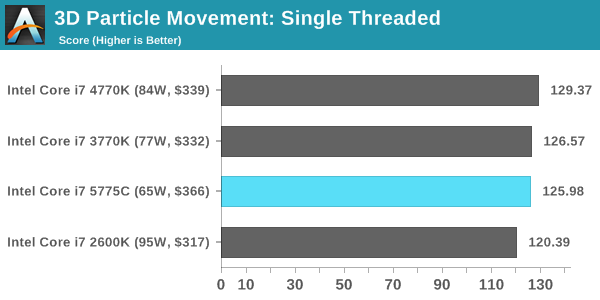
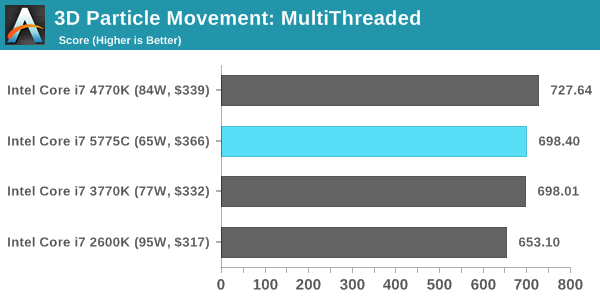
3D Particle Movement
3DPM is a self-penned benchmark, taking basic 3D movement algorithms used in Brownian Motion simulations and testing them for speed. High floating point performance, MHz and IPC wins in the single thread version, whereas the multithread version has to handle the threads and loves more cores.
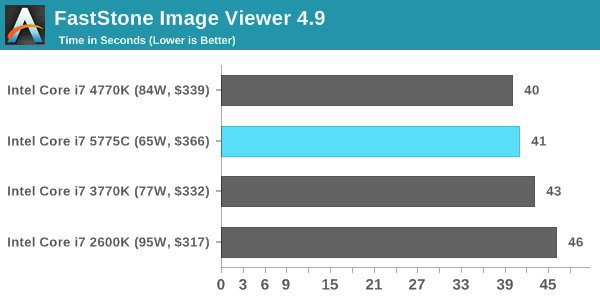
FastStone Image Viewer 4.9
FastStone is the program I use to perform quick or bulk actions on images, such as resizing, adjusting for color and cropping. In our test we take a series of 170 images in various sizes and formats and convert them all into 640x480 .gif files, maintaining the aspect ratio. FastStone does not use multithreading for this test, and results are given in seconds.
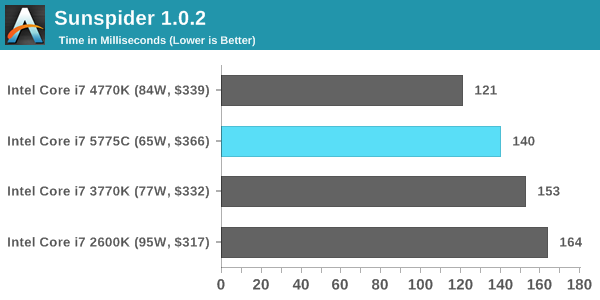
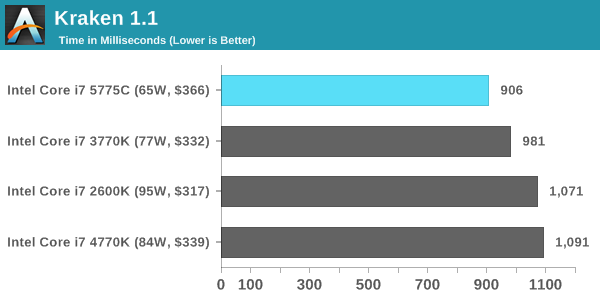
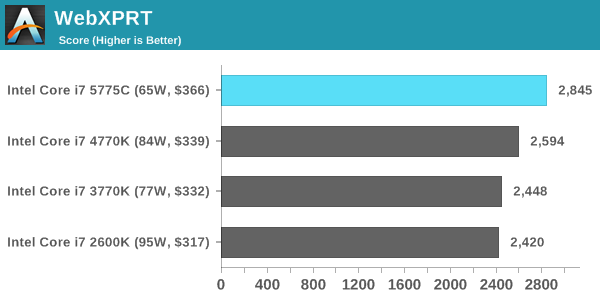
Web Benchmarks
On the lower end processors, general usability is a big factor of experience, especially as we move into the HTML5 era of web browsing. For our web benchmarks, we take four well known tests with Chrome 35 as a consistent browser.


121 Comments
View All Comments
Shadow7037932 - Monday, August 3, 2015 - link
Still running a i7 920 @ 3.8Ghz on custom water cooling. OS, SSDs, HDDs, GPUs, have all been upgraded since 2009. Still holding it's own in gaming and multithreaded software (video rendering).Also, with the hexacore X5650 being available for around $70-100 used, I can probably breathe a bit more life into this.
milli - Tuesday, August 4, 2015 - link
I invested big time in my X58 platform but it's still going strong. One year ago I upgraded my i7 920 to a Xeon X5650 (which I bought second hand for like $100). Now I have a six core HT 32nm OC'd beast that runs much cooler than my 920. I can't believe this platform is now 7 years old.Jetpil0t - Thursday, August 6, 2015 - link
I have been waiting for so long to upgrade my 2500k an R9 290, was looking at a 6600k and Fury X but for like $2,000 the performance really isn't there. Second hand 290 for $250 will probably be my next upgrade and still faster than a brand new 6600k Fury build. More money for games I guess.michael2k - Monday, August 3, 2015 - link
Is that entirely true? It seems from the graphs that you can expect 10% to 20% improvement in performance at the same clock compared to Sandy Bridge and the Broadwell is a good 30% less in terms of power consumption. In other words the 0.25V difference in overclock is exactly the reason Broadwell consumes 30% less power. Since you don't care about the power then you can clock it up and volt it up and see a 10% to 20% improvement in performance. You can argue that the 10% to 20% improvement isn't worth it, of course. The IPC gains only matter if you care to overclock the Broadwell part.sonny73n - Tuesday, August 4, 2015 - link
"my ivy bridge 3570k does the same clock with 1.075v."1.075v @4.2GHz? Are you sure you didn't mistype? Prime95 stress test?
Jetpil0t - Thursday, August 6, 2015 - link
Still rocking a i5 2500k @ 4.0Ghz and an R9 290 @ 1.1Ghz and it's rockin along no problem, I want to but new shiny things, but there is zero reason to, which is nice for the value but a little odd given the age of this processor. If I had known I was going to be hanging onto this CPU for so long I would have picked up the i7 2600/2700k, but even then, the i5 2500k is a powerhouse, apparently. Just puts into perspective how crazy powerful these CPUs were 5 years ago when they landed.Jetpil0t - Thursday, August 6, 2015 - link
They should just take each of these CPUs to 4.0Ghz locked and bench it out, I bet the 2600k still fires up there with the best of them. The sample used here is still stock, so with an OC it's more or less up there all the way through to a 980ti.Oxford Guy - Thursday, January 21, 2016 - link
Proper Broadwell overclocking appears to require that the EDRAM clock be changed. They didn't do that here, hence the poor result.K_Space - Monday, August 3, 2015 - link
For desktop users the article only consolidated what was already known: hold tight to your Haswell CPU until Skylake (and even then you probably won't need to upgrade). The Z97 chipset is such a mature platform and the high frequency clocked parts have dropped in price. The 4790K is an absolute brute. Haswell -just like Sandy and Nehalem is going to be very stretchy generation.Nagorak - Tuesday, August 4, 2015 - link
Forget that, just hold tight to your Sandy Bridge. Four years running and you can make up most of the difference in IPC by just cranking up the clock. Once you take the lower frequency into account, Broadwell's ~18% improvement drops to only around 10%.