The Intel Broadwell Review Part 2: Overclocking, IPC and Generational Analysis
by Ian Cutress on August 3, 2015 8:00 AM ESTGenerational Tests: Office and Web Benchmarks
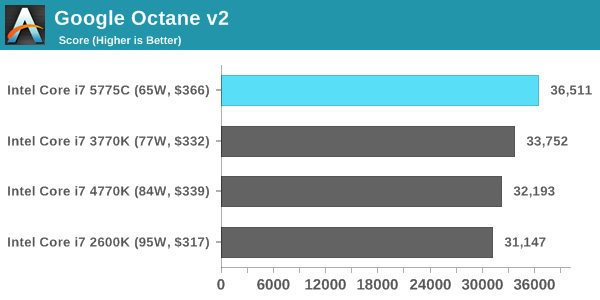
For this review, as mentioned on the front page, we retested some of the older CPUs under our new methodology. We did this testing at stock frequency as well as the IPC testing to see the ultimate real world result when you add in HyperThreading and frequency into the mix. If you recall back in our Devil’s Canyon i7-4790K review, the new high 4.4 GHz frequency of the i7-4790K was a tough one to beat for the newer architecture purely because any IPC gains are nullified by the older processor having a lot more frequency. With the Broadwell based i7-5775C being at 3.7 GHz and only 65W, this is a tough task. But what about if you are still running the Sandy Bridge based i7-2600K?
Some users will notice that in our benchmark database Bench, we keep data on the CPUs we’ve tested back over a decade and the benchmarks we were running back then. For a few of these benchmarks, such as Cinebench R10, we do actually run these on the new CPUs as well, although for the sake of brevity and relevance we tend not to put this data in the review. Well here are a few of those numbers too.
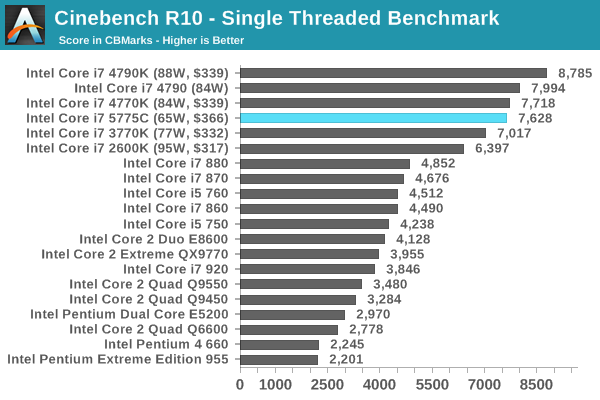
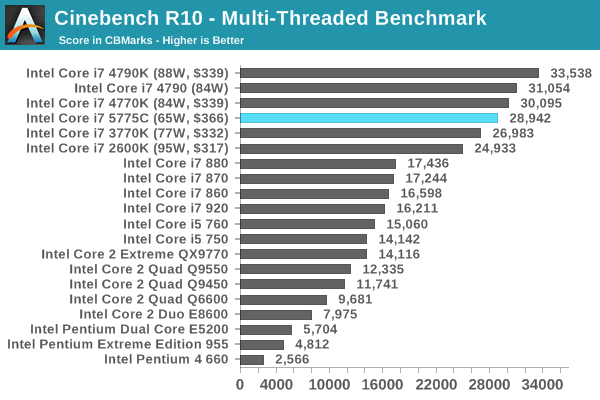
With some of these benchmarks, due to applications using new instruction sets, having the newer processors with the new instructions can make a lot of difference. Even in Cinebench R10, moving from the Core 2 Quad Q9550 to a Broadwell can get a 2.5x speed-up in this old software.
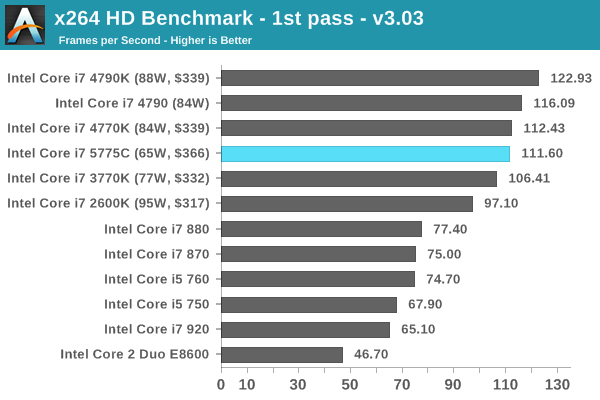
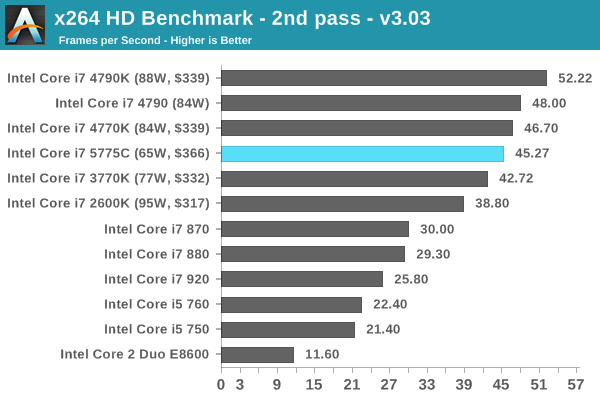
For the rest of our CPU benchmarks, here is what the landscape looks like with the most recent architectures. All of our benchmark results can also be found in our benchmark engine, Bench.
Office Performance
The dynamics of CPU Turbo modes, both Intel and AMD, can cause concern during environments with a variable threaded workload. There is also an added issue of the motherboard remaining consistent, depending on how the motherboard manufacturer wants to add in their own boosting technologies over the ones that Intel would prefer they used. In order to remain consistent, we implement an OS-level unique high performance mode on all the CPUs we test which should override any motherboard manufacturer performance mode.
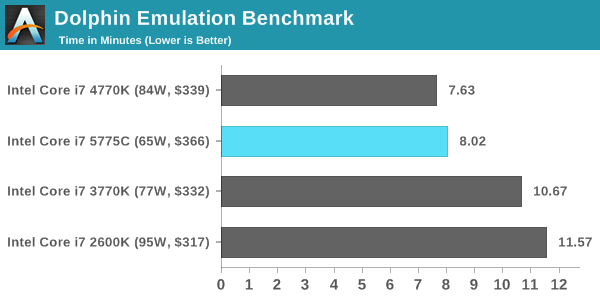
Dolphin Benchmark: link
Many emulators are often bound by single thread CPU performance, and general reports tended to suggest that Haswell provided a significant boost to emulator performance. This benchmark runs a Wii program that raytraces a complex 3D scene inside the Dolphin Wii emulator. Performance on this benchmark is a good proxy of the speed of Dolphin CPU emulation, which is an intensive single core task using most aspects of a CPU. Results are given in minutes, where the Wii itself scores 17.53 minutes.
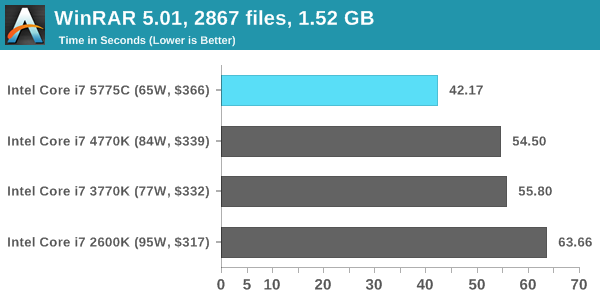
WinRAR 5.0.1: link
Our WinRAR test from 2013 is updated to the latest version of WinRAR at the start of 2014. We compress a set of 2867 files across 320 folders totaling 1.52 GB in size – 95% of these files are small typical website files, and the rest (90% of the size) are small 30 second 720p videos.
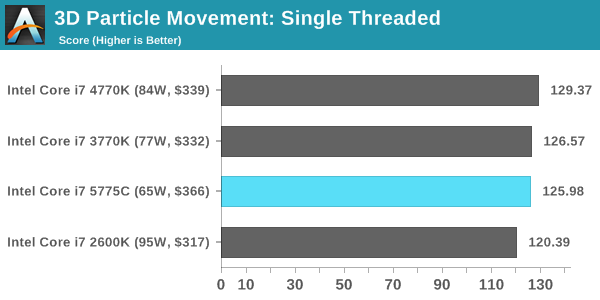
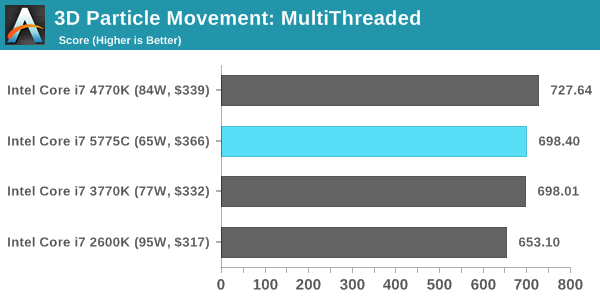
3D Particle Movement
3DPM is a self-penned benchmark, taking basic 3D movement algorithms used in Brownian Motion simulations and testing them for speed. High floating point performance, MHz and IPC wins in the single thread version, whereas the multithread version has to handle the threads and loves more cores.
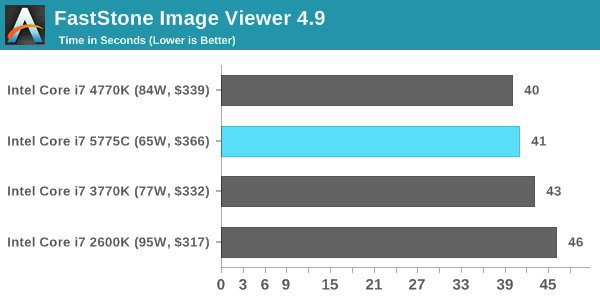
FastStone Image Viewer 4.9
FastStone is the program I use to perform quick or bulk actions on images, such as resizing, adjusting for color and cropping. In our test we take a series of 170 images in various sizes and formats and convert them all into 640x480 .gif files, maintaining the aspect ratio. FastStone does not use multithreading for this test, and results are given in seconds.
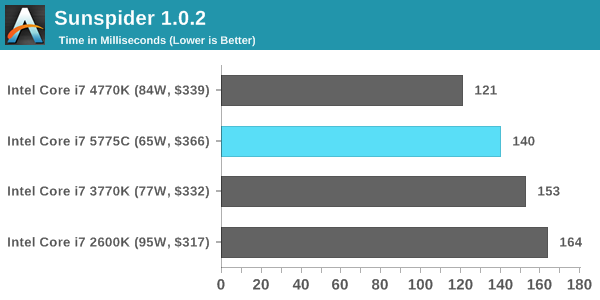
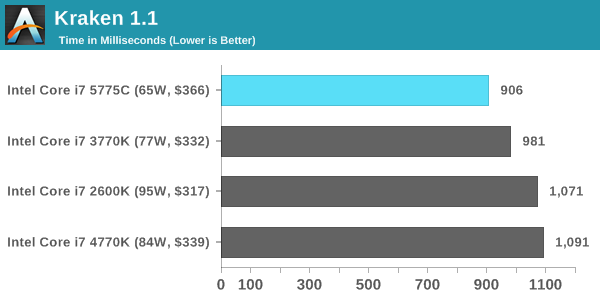
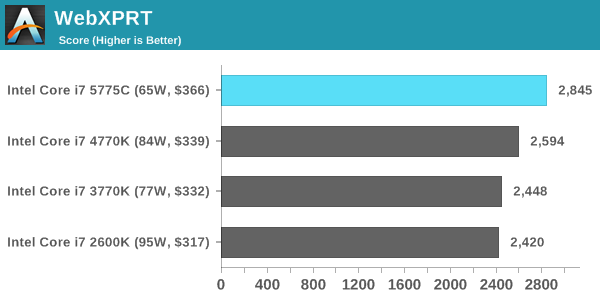
Web Benchmarks
On the lower end processors, general usability is a big factor of experience, especially as we move into the HTML5 era of web browsing. For our web benchmarks, we take four well known tests with Chrome 35 as a consistent browser.


121 Comments
View All Comments
Oxford Guy - Tuesday, August 4, 2015 - link
No gaming results.TheJian - Monday, August 3, 2015 - link
I was hoping any more coverage of broadwell would include ripping quality comparisons to haswell at least. Is it still fast but crappy, or have they fixed quality so I don't have to keep my gpu off? :( Throw some handbrake tests in please. Quicksync fixed yet?http://www.anandtech.com/show/7007/intels-haswell-...
Any changes since this? Or the review by anand that covered it (linked in there)? Or do we all just hope for a fix with skylake? I saw a recent software update for haswell, but not sure if that does anything about quality here.
Enterprise24 - Tuesday, August 4, 2015 - link
Grid Autosport with 290X show very strange result. I assume this game support AVX2 instruction set ? Since Sandy and Ivy have roughly the same performance. But jump to Haswell gain big improvement.StrangerGuy - Tuesday, August 4, 2015 - link
Yawn...At this point I'm more interested in much better utilisation of hardware through software like DX12 than sinking tens of billions into CPU die shrinks with next to zero real world benefit. The paradox here is of course how the former will make the latter even more irrelevant as it is.lukarak - Tuesday, August 4, 2015 - link
i7-920 waving...Still no reason to upgrade. It was released in 2008, bought it early 2009. and it has been quite sufficient for almost 6.5 years now.
HeJoSpartans - Tuesday, August 4, 2015 - link
Hello Ian,Unfortunately, your IPC increase charts on page 3 of the article reveal several mistakes. The benchmark charts show that the Broadwell chip is not the fastest on both the 3DPM:ST as well as the CBenchR15:MT benchmarks, while your IPC increase charts tell something completely different. Also, some of the other calculated IPC increase values stated in the charts are completely irreproducable on my side. Second, you made a systematic mistake in calculating the IPC increase for the "Lower is better" benchmarks. This is very crucial especially in the Dolphin benchmark, where the total IPC increase from SB to Broadwell would be 58.0% rather than 36.7%. To make this clear: Processor A, that takes half the time for performing a certain task compared to processor B, does not offer a 50% increase in IPC over B, but a total of 100%.
You should re-check your numbers. Hope this helps.
Ian Cutress - Tuesday, August 4, 2015 - link
Hi HeJoSpartans,Somehow the incorrect benchmark result graphs were placed in those spots and they were from the non 3GHz testing - they also had a different z-height. I have updated it - the IPC numbers for those benchmarks in the main graphs are still accurate. For those benchmarks at stock voltage, the balance between frequency and IPC as to which is more important plays out on a larger scale for sure.
Also, with the timed benchmarks. Arguably I actually labelled the axis in terms of Percentage Improvement rather than IPC improvement, despite the title of the benchmark. But you are correct - I mistakenly used the % improvement and the term IPC interchangeably. I have updated the results with a disclaimer.
Any other issues, let me know. I'm also contactable by email if urgent!
-Ian
Navvie - Tuesday, August 4, 2015 - link
No compelling reason to upgrade from my 4770k.Intel needs to get back to working on CPU development rather than GPU.
Speedfriend - Tuesday, August 4, 2015 - link
I have a question. I have seen a article on Intel that speculates that it intends to launch a new chip that has a larger eDRAM (1Gb) and then has 3d Xpoint (15GB) on. The large eDRAM will compensate for the lower write speed of the 3d Xpoint, however the overall chip will offer massive advantages in power consumption and having nonvolatile memory for sleep states. This would be extremely competitive for mobile computing and servers.Given this quote above "Cycling back to our WinRAR test, things look a little different. Ivy Bridge to Haswell gives only a 3.1% difference, but the eDRAM in Broadwell slaps on another 16.6% performance increase, dropping the benchmark from 76.65 seconds to 63.91 seconds. When eDRAM counts, it counts a lot." would that make sense.
The article says that this change in chip design is the reason we are seeing another tock for kaby lake.
Any view from CPU experts on here?
NeilPeartRush - Tuesday, August 4, 2015 - link
1999: Intel Celeron 300A @ 450MHz2003: AMD Athlon XP-M 2200+ @ 2.40GHz
2007: Intel Q6600 @ 3.60GHz
2011: Intel i5-2500K @ 4.8GHz
2015: Skylake?