The Intel Broadwell Review Part 2: Overclocking, IPC and Generational Analysis
by Ian Cutress on August 3, 2015 8:00 AM ESTGaming Benchmarks: High End
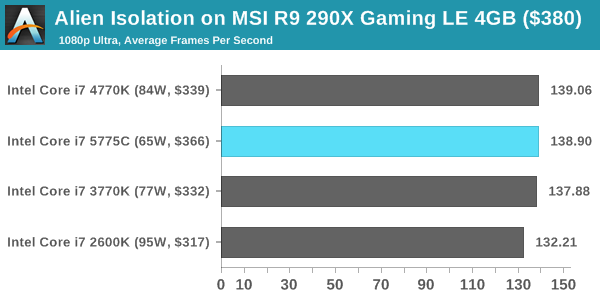
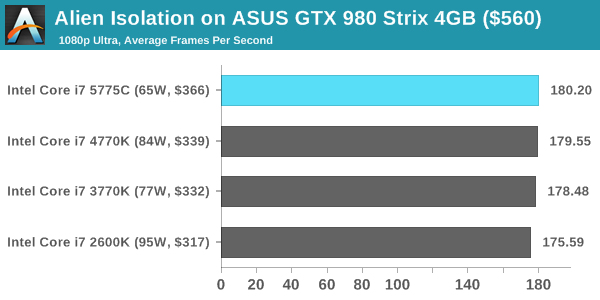
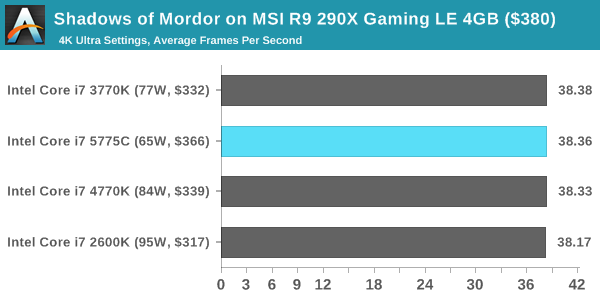
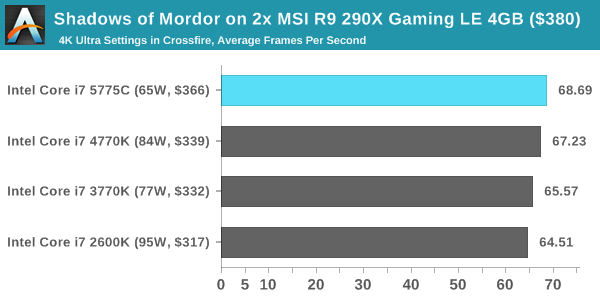
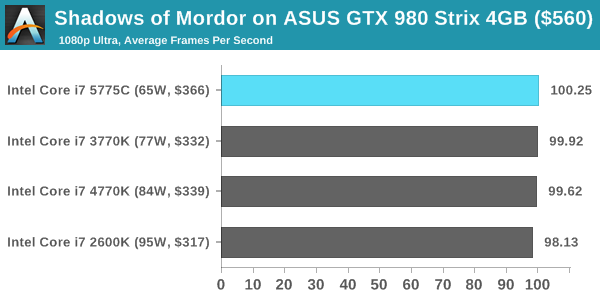
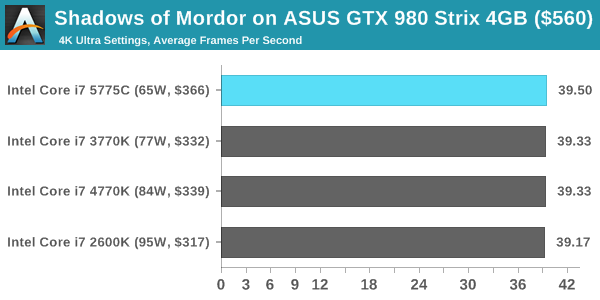
At the top of the line we take the best GPUs on the market from May 2015 - an AMD R9 290X and an NVIDIA GTX 980.
Alien: Isolation
If first person survival mixed with horror is your sort of thing, then Alien: Isolation, based off of the Alien franchise, should be an interesting title. Developed by The Creative Assembly and released in October 2014, Alien: Isolation has won numerous awards from Game Of The Year to several top 10s/25s and Best Horror titles, ratcheting up over a million sales by February 2015. Alien: Isolation uses a custom built engine which includes dynamic sound effects and should be fully multi-core enabled.
For low end graphics, we test at 720p with Ultra settings, whereas for mid and high range graphics we bump this up to 1080p, taking the average frame rate as our marker with a scripted version of the built-in benchmark.

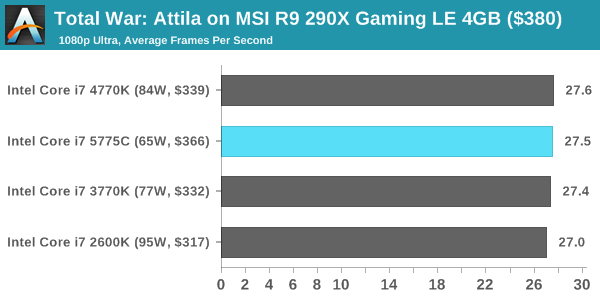
Total War: Attila
The Total War franchise moves on to Attila, another The Creative Assembly development, and is a stand-alone strategy title set in 395AD where the main story line lets the gamer take control of the leader of the Huns in order to conquer parts of the world. Graphically the game can render hundreds/thousands of units on screen at once, all with their individual actions and can put some of the big cards to task.
For low end graphics, we test at 720p with performance settings, recording the average frame rate. With mid and high range graphics, we test at 1080p with the quality setting. In both circumstances, unlimited video memory is enabled and the in-game scripted benchmark is used.


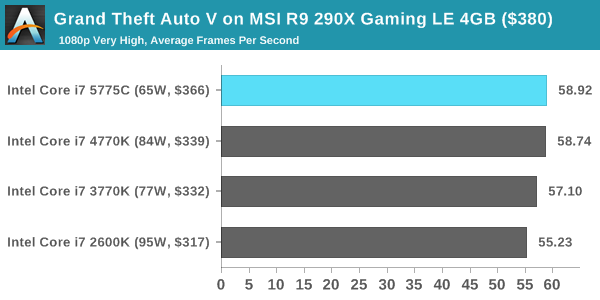
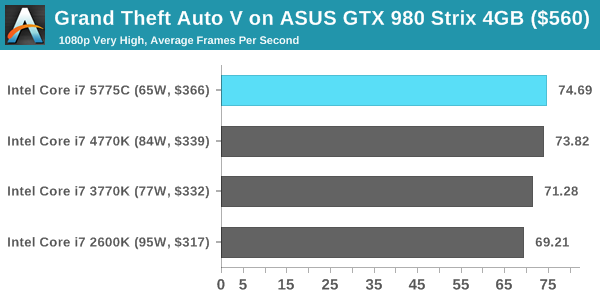
Grand Theft Auto V
The highly anticipated iteration of the Grand Theft Auto franchise finally hit the shelves on April 14th 2015, with both AMD and NVIDIA in tow to help optimize the title. GTA doesn’t provide graphical presets, but opens up the options to users and extends the boundaries by pushing even the hardest systems to the limit using Rockstar’s Advanced Game Engine. Whether the user is flying high in the mountains with long draw distances or dealing with assorted trash in the city, when cranked up to maximum it creates stunning visuals but hard work for both the CPU and the GPU.
For our test we have scripted a version of the in-game benchmark, relying only on the final part which combines a flight scene along with an in-city drive-by followed by a tanker explosion. For low end systems we test at 720p on the lowest settings, whereas mid and high end graphics play at 1080p with very high settings across the board. We record both the average frame rate and the percentage of frames under 60 FPS (16.6ms).

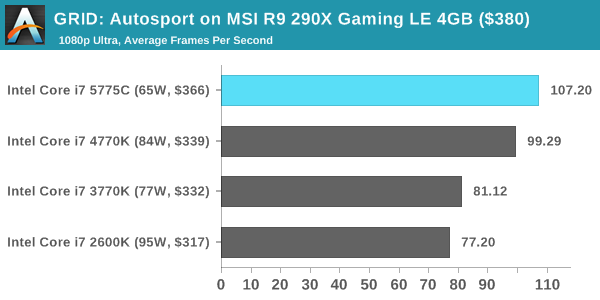
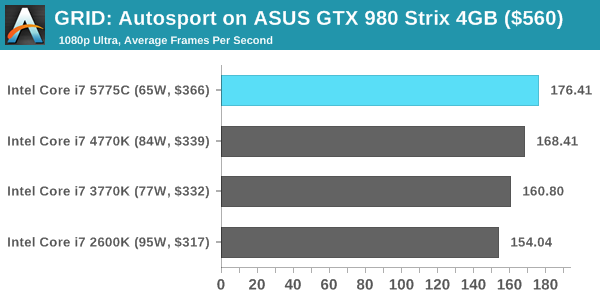
GRID: Autosport
No graphics tests are complete without some input from Codemasters and the EGO engine, which means for this round of testing we point towards GRID: Autosport, the next iteration in the GRID and racing genre. As with our previous racing testing, each update to the engine aims to add in effects, reflections, detail and realism, with Codemasters making ‘authenticity’ a main focal point for this version.
GRID’s benchmark mode is very flexible, and as a result we created a test race using a shortened version of the Red Bull Ring with twelve cars doing two laps. The car is focus starts last and is quite fast, but usually finishes second or third. For low end graphics we test at 1080p medium settings, whereas mid and high end graphics get the full 1080p maximum. Both the average and minimum frame rates are recorded.

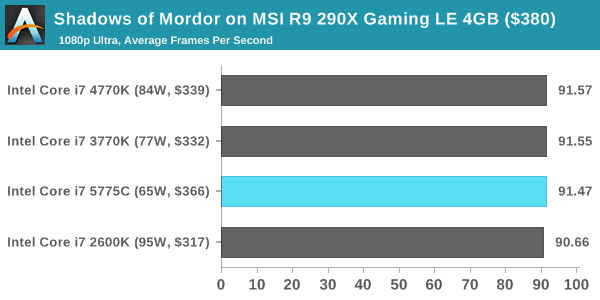
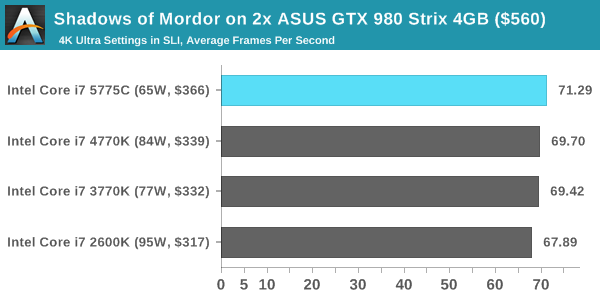
Middle-Earth: Shadows of Mordor
The final title in our testing is another battle of system performance with the open world action-adventure title, Shadows of Mordor. Produced by Monolith using the LithTech Jupiter EX engine and numerous detail add-ons, SoM goes for detail and complexity to a large extent, despite having to be cut down from the original plans. The main story itself was written by the same writer as Red Dead Redemption, and it received Zero Punctuation’s Game of The Year in 2014.
For testing purposes, SoM gives a dynamic screen resolution setting, allowing us to render at high resolutions that are then scaled down to the monitor. As a result, we get several tests using the in-game benchmark. For low end graphics we examine at 720p with low settings, whereas mid and high end graphics get 1080p Ultra. The top graphics test is also redone at 3840x2160, also with Ultra settings, and we also test two cards at 4K where possible.


121 Comments
View All Comments
Oxford Guy - Tuesday, August 4, 2015 - link
No gaming results.TheJian - Monday, August 3, 2015 - link
I was hoping any more coverage of broadwell would include ripping quality comparisons to haswell at least. Is it still fast but crappy, or have they fixed quality so I don't have to keep my gpu off? :( Throw some handbrake tests in please. Quicksync fixed yet?http://www.anandtech.com/show/7007/intels-haswell-...
Any changes since this? Or the review by anand that covered it (linked in there)? Or do we all just hope for a fix with skylake? I saw a recent software update for haswell, but not sure if that does anything about quality here.
Enterprise24 - Tuesday, August 4, 2015 - link
Grid Autosport with 290X show very strange result. I assume this game support AVX2 instruction set ? Since Sandy and Ivy have roughly the same performance. But jump to Haswell gain big improvement.StrangerGuy - Tuesday, August 4, 2015 - link
Yawn...At this point I'm more interested in much better utilisation of hardware through software like DX12 than sinking tens of billions into CPU die shrinks with next to zero real world benefit. The paradox here is of course how the former will make the latter even more irrelevant as it is.lukarak - Tuesday, August 4, 2015 - link
i7-920 waving...Still no reason to upgrade. It was released in 2008, bought it early 2009. and it has been quite sufficient for almost 6.5 years now.
HeJoSpartans - Tuesday, August 4, 2015 - link
Hello Ian,Unfortunately, your IPC increase charts on page 3 of the article reveal several mistakes. The benchmark charts show that the Broadwell chip is not the fastest on both the 3DPM:ST as well as the CBenchR15:MT benchmarks, while your IPC increase charts tell something completely different. Also, some of the other calculated IPC increase values stated in the charts are completely irreproducable on my side. Second, you made a systematic mistake in calculating the IPC increase for the "Lower is better" benchmarks. This is very crucial especially in the Dolphin benchmark, where the total IPC increase from SB to Broadwell would be 58.0% rather than 36.7%. To make this clear: Processor A, that takes half the time for performing a certain task compared to processor B, does not offer a 50% increase in IPC over B, but a total of 100%.
You should re-check your numbers. Hope this helps.
Ian Cutress - Tuesday, August 4, 2015 - link
Hi HeJoSpartans,Somehow the incorrect benchmark result graphs were placed in those spots and they were from the non 3GHz testing - they also had a different z-height. I have updated it - the IPC numbers for those benchmarks in the main graphs are still accurate. For those benchmarks at stock voltage, the balance between frequency and IPC as to which is more important plays out on a larger scale for sure.
Also, with the timed benchmarks. Arguably I actually labelled the axis in terms of Percentage Improvement rather than IPC improvement, despite the title of the benchmark. But you are correct - I mistakenly used the % improvement and the term IPC interchangeably. I have updated the results with a disclaimer.
Any other issues, let me know. I'm also contactable by email if urgent!
-Ian
Navvie - Tuesday, August 4, 2015 - link
No compelling reason to upgrade from my 4770k.Intel needs to get back to working on CPU development rather than GPU.
Speedfriend - Tuesday, August 4, 2015 - link
I have a question. I have seen a article on Intel that speculates that it intends to launch a new chip that has a larger eDRAM (1Gb) and then has 3d Xpoint (15GB) on. The large eDRAM will compensate for the lower write speed of the 3d Xpoint, however the overall chip will offer massive advantages in power consumption and having nonvolatile memory for sleep states. This would be extremely competitive for mobile computing and servers.Given this quote above "Cycling back to our WinRAR test, things look a little different. Ivy Bridge to Haswell gives only a 3.1% difference, but the eDRAM in Broadwell slaps on another 16.6% performance increase, dropping the benchmark from 76.65 seconds to 63.91 seconds. When eDRAM counts, it counts a lot." would that make sense.
The article says that this change in chip design is the reason we are seeing another tock for kaby lake.
Any view from CPU experts on here?
NeilPeartRush - Tuesday, August 4, 2015 - link
1999: Intel Celeron 300A @ 450MHz2003: AMD Athlon XP-M 2200+ @ 2.40GHz
2007: Intel Q6600 @ 3.60GHz
2011: Intel i5-2500K @ 4.8GHz
2015: Skylake?