AMD A10-7800 Review: Testing the A10 65W Kaveri
by Ian Cutress on July 31, 2014 8:00 AM ESTCPU Benchmarks
The dynamics of CPU Turbo modes, both Intel and AMD, can cause concern during environments with a variable threaded workload. There is also an added issue of the motherboard remaining consistent, depending on how the motherboard manufacturer wants to add in their own boosting technologies over the ones that Intel would prefer they used. In order to remain consistent, we implement an OS-level unique high performance mode on all the CPUs we test which should override any motherboard manufacturer performance mode.
HandBrake v0.9.9: link
For HandBrake, we take two videos (a 2h20 640x266 DVD rip and a 10min double UHD 3840x4320 animation short) and convert them to x264 format in an MP4 container. Results are given in terms of the frames per second processed, and HandBrake uses as many threads as possible.
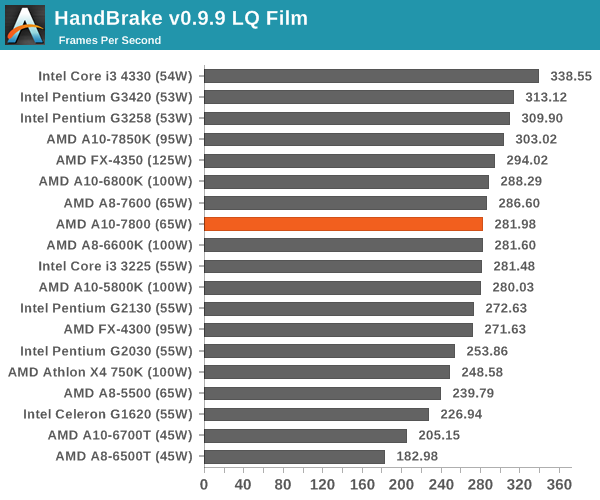
The latest Intel processors have the lead for low quality Handbrake conversion, and despite the generational gap between the FX-4350 and the A10-7800, the extra MHz is preferred here.
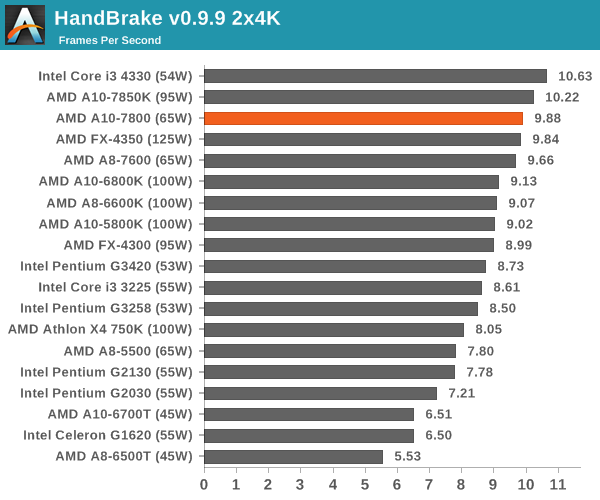
For large frame manipulation, the latest architectures mixed with the most threads perform best.
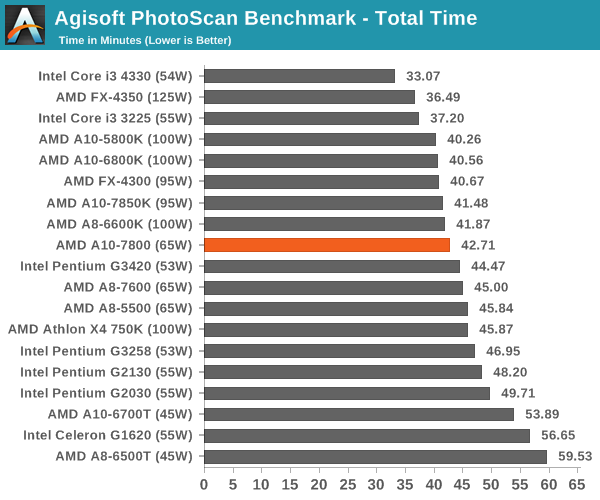
Agisoft Photoscan – 2D to 3D Image Manipulation: link
Agisoft Photoscan creates 3D models from 2D images, a process which is very computationally expensive. The algorithm is split into four distinct phases, and different phases of the model reconstruction require either fast memory, fast IPC, more cores, or even OpenCL compute devices to hand. Agisoft supplied us with a special version of the software to script the process, where we take 50 images of a stately home and convert it into a medium quality model. This benchmark typically takes around 15-20 minutes on a high end PC on the CPU alone, with GPUs reducing the time.
Dolphin Benchmark: link
Many emulators are often bound by single thread CPU performance, and general reports tended to suggest that Haswell provided a significant boost to emulator performance. This benchmark runs a Wii program that raytraces a complex 3D scene inside the Dolphin Wii emulator. Performance on this benchmark is a good proxy of the speed of Dolphin CPU emulation, which is an intensive single core task using most aspects of a CPU. Results are given in minutes, where the Wii itself scores 17.53 minutes.
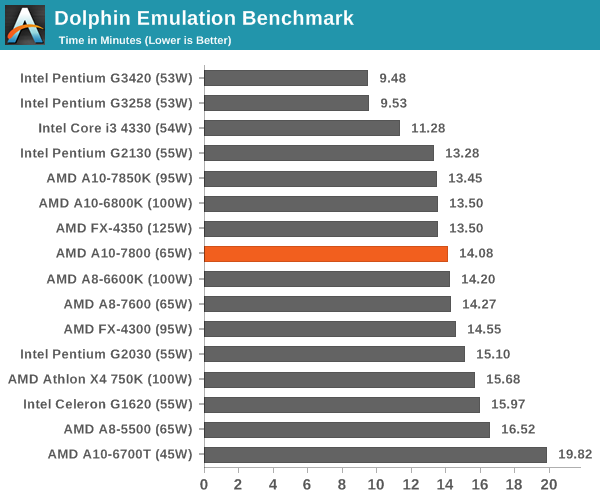
Dolphin seems to work best with high single core speed and Haswell.
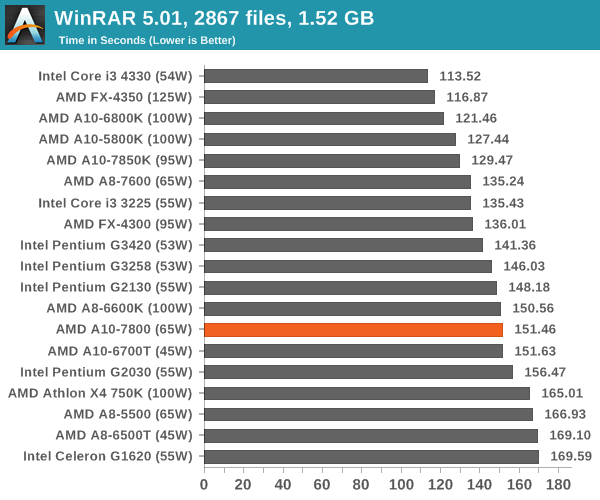
WinRAR 5.0.1: link
PCMark8 v2 OpenCL on IGP
A new addition to our CPU testing suite is PCMark8 v2, where we test the Work 2.0 and Creative 3.0 suites in OpenCL mode. As this test is new, we have not run it on many AMD systems yet and will do so as soon as we can.
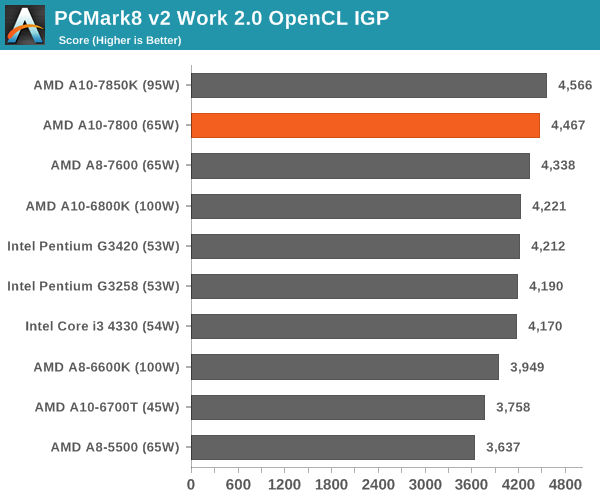
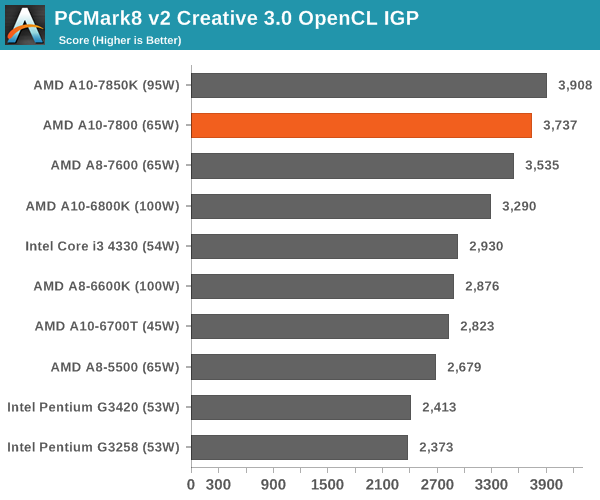
The combination of processor graphics and OpenCL support push the AMD APUs up to the top of our PCMark tests.
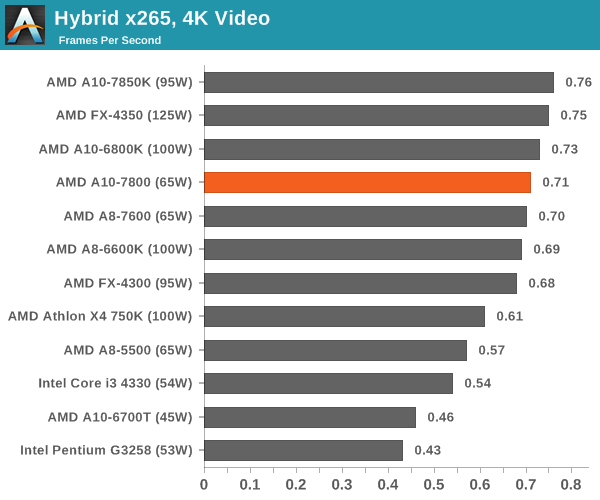
Hybrid x265
Hybrid is a new benchmark, where we take a 4K 1500 frame video and convert it into an x265 format without audio. Results are given in frames per second.
Cinebench R15
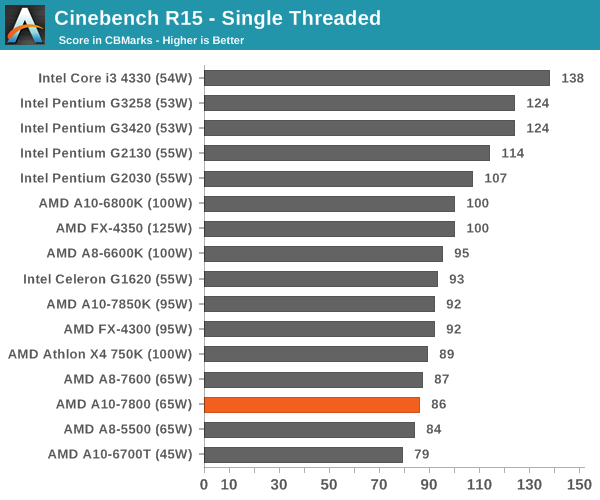
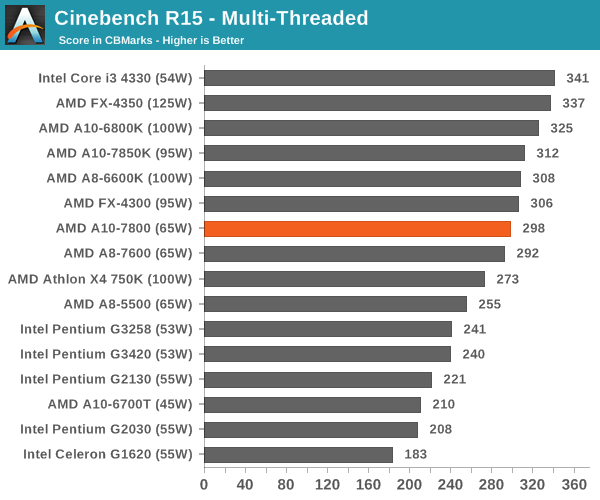
Cinebench is typically Intel territory for high IPC processors, but when it comes to multithreaded rendering, extra threads help.
3D Particle Movement
3DPM is a self-penned benchmark, taking basic 3D movement algorithms used in Brownian Motion simulations and testing them for speed. High floating point performance, MHz and IPC wins in the single thread version, whereas the multithread version has to handle the threads and loves more cores.
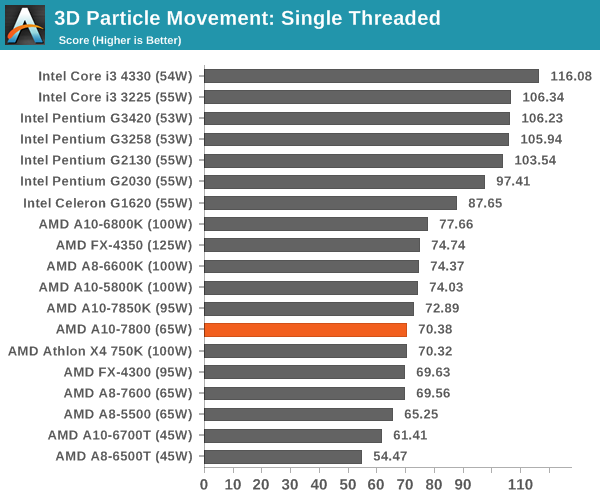
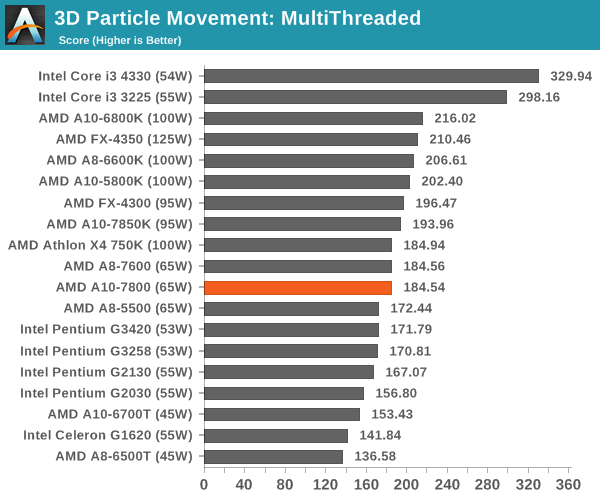
All the calculations in 3DPM deal with floating point numbers, a known sink for AMD compute.
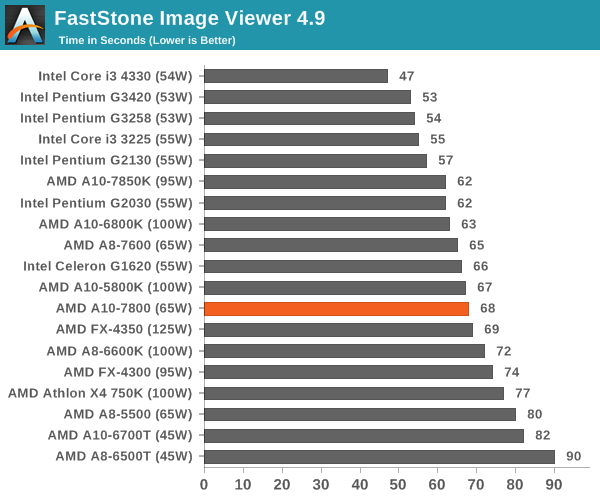
FastStone Image Viewer 4.9
FastStone is the program I use to perform quick or bulk actions on images, such as resizing, adjusting for color and cropping. In our test we take a series of 170 images in various sizes and formats and convert them all into 640x480 .gif files, maintaining the aspect ratio. FastStone does not use multithreading for this test, and results are given in seconds.
Web Benchmarks
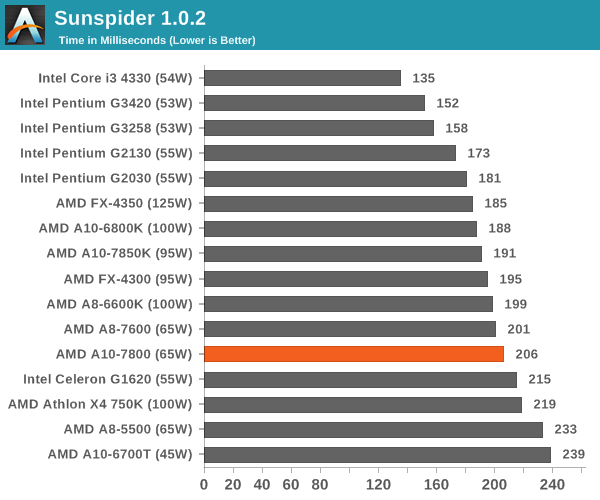
On the lower end processors, general usability is a big factor of experience, especially as we move into the HTML5 era of web browsing. For our web benchmarks, we take four well known tests with Chrome 35 as a consistent browser.
Sunspider 1.0.2
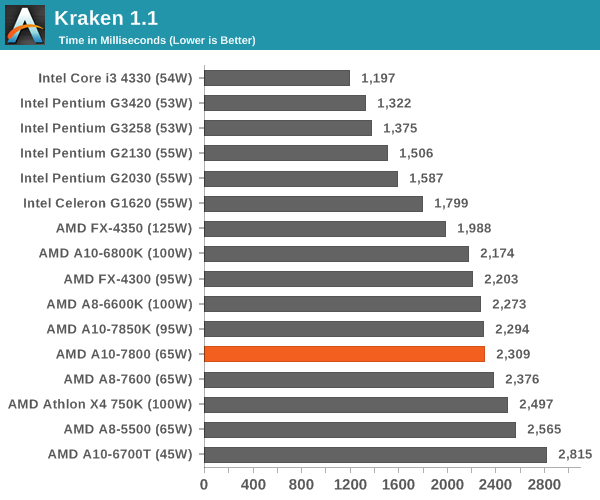
Mozilla Kraken 1.1
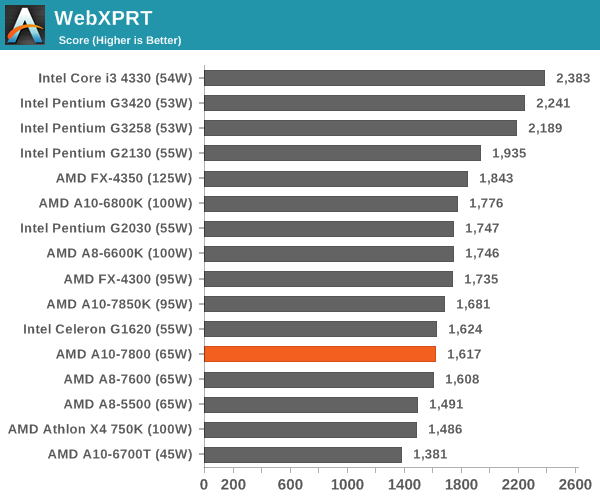
WebXPRT
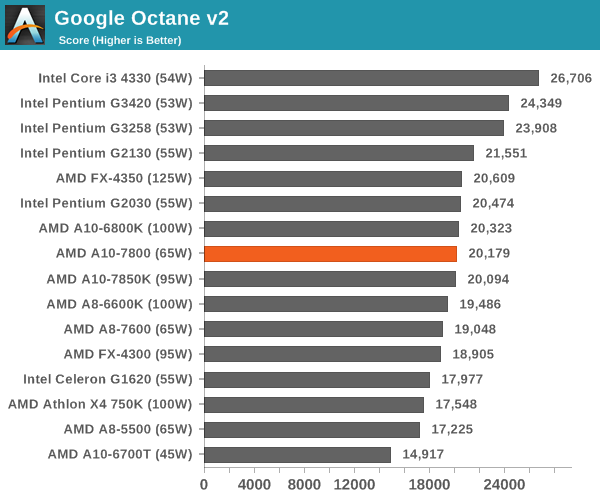
Google Octane v2


147 Comments
View All Comments
DigitalFreak - Thursday, July 31, 2014 - link
I'll take Conspiracy Theories for $100, Alex.Essence_of_War - Thursday, July 31, 2014 - link
Really?Here's the big haswell review:
http://www.anandtech.com/print/7003/the-haswell-re...
Here's the first Kaveri review:
http://www.anandtech.com/print/7677/amd-kaveri-rev...
Here's the Devil's Canyon review:
http://www.anandtech.com/print/8227/devils-canyon-...
There were platform power benches in all of them. Haswell-big has idle/load for a smattering of i5's/i7's, Devil's Canyon had an OC overview of system power consumption. Same with Kaveri.
DanNeely - Thursday, July 31, 2014 - link
Could you add a few low/mid end discrete GPUs that fall into the same performance bucket as Kaveri's IGP for comparison purposes?jaydee - Thursday, July 31, 2014 - link
The A10-7800 65W looks like a winner in it's market (budget gaming). Unfortunately, that's not a very large market, and if you're looking to upgrade the CPU down the road, you are quite limited.On a side note, it seems odd that 1280x1024 was chosen as the resolution for the gaming benchmarks. It's been probably a decade since the 5:4 aspect ratio monitors have been sold in the mainstream. 1440x900 or 1600x900 would make more sense, with similar total number of pixels.
Essence_of_War - Thursday, July 31, 2014 - link
This!I'd like to see a move to 1280x720 or 1600x900 for these sort of low-end graphics parts. Most living room TV's are 1920x1080, but depending on your set-up 1280x720 or 1600x900 might still look pretty good.
jabber - Thursday, July 31, 2014 - link
I would have thought 1366x768 should be the minimum benchmark size nowadays.All the others are quite custom and the average Joe won't be using them.
DanNeely - Thursday, July 31, 2014 - link
1600x900 is the current mid level gfx setting for mobile reviews; 1366x786 is the low end level. don't know why it couldn't be added to IGP benching too. The next time the IGP benchmark process is updated either of them would make more sense as a target. 1600x900 is closer in terms of pixel count; but 1366x768 is probably a more realistic option for most IGP gaming if only a single resolution is tested, since only the highest end IGPs can get FPSes high enough to play at anything higher.Essence_of_War - Thursday, July 31, 2014 - link
1280x720 is a standard resolution for TVs. For a light gaming HTPC type load, I think that's pretty reasonable to test.Guspaz - Thursday, July 31, 2014 - link
Umm, NewEgg has 146 different monitors with 1280x1024 resolution available. They're definitely still extremely mainstream, and there are only two resolutions that they have more selections for, 1920x1080 and 2560x1440.SparklesP - Thursday, July 31, 2014 - link
Still available if you're looking to buy an older budget monitor or are in the market for refurbished, but they are basically only being made to wholesale to cheap businesses these days.