Smartphone Audio Quality Testing
by Chris Heinonen on December 8, 2013 5:15 PM EST- Posted in
- Smartphones
- Audio
- Mobile
- Tablets
- Testing
THD+N is a measure of the total harmonic distortion and noise compared to the signal. The lower the number, the less distortion and noise there is relative to the fundamental frequency. THD+N is measured by driving a 1 kHz sine wave at maximum volume. Because there is always some inherent background noise, the THD+N is almost always lowest at maximum output so that is used for the measurement.
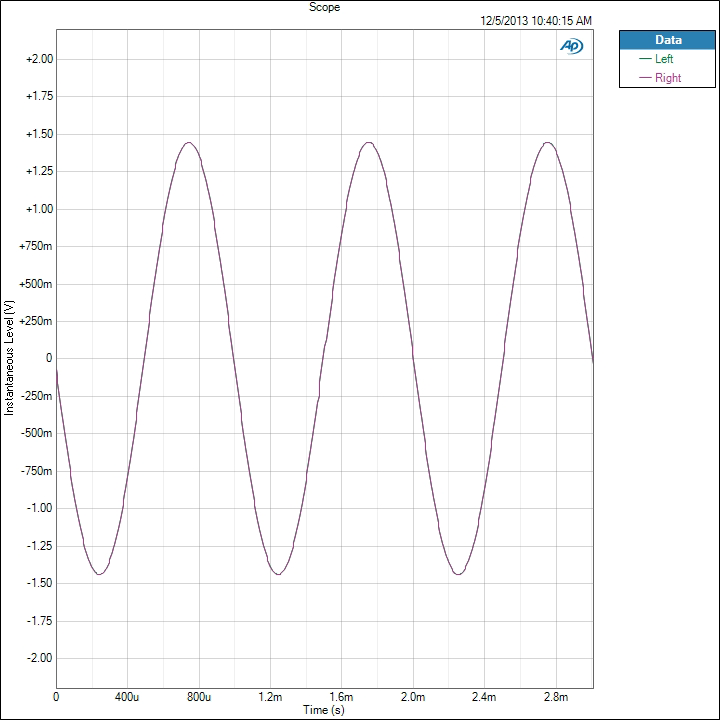
There are two results that we take from this: a sine wave and a FFT spectrum. On the sine wave both channels should line up perfectly, and it should be as close to an accurate sine wave as possible. On the FFT we want to see a peak at 1 kHz and everything else as low as possible. The most common artifact you will see are harmonic sidebands at multiples of 1 kHz.
For an example of data that looks good, here is the sine wave of the iPhone 5. We see a sine wave that is good, with channels that overlap perfectly and no deviation. This is what we expect to see.
Now for a different example we look at the Nexus 5. Run at maximum volume we see that the left channel is clipping in the sine wave. Likely the power to the headphone amplifier is not enough to drive both channels and so this is the result. UPDATE: Tested this with 4.4.1 and no change.
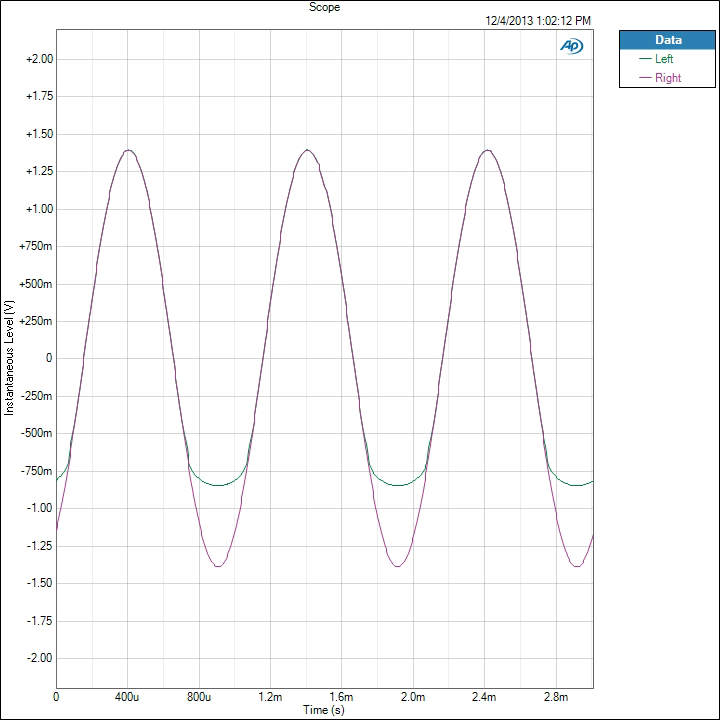
The iPhone 5 produces a THD+N ratio of 0.003134% while because of the clipping, the Nexus 5 is producing 13.789197%. Any level over 1% is considered to be past the clipping point of an amplifier and it seems that the Nexus 5 cannot be driven at maximum volume. I tested two samples to verify, and on both the performance is identical.
Now if we look at the FFT for this test, we see how this distortion is showing up. First, the iPhone 5 is very quiet.
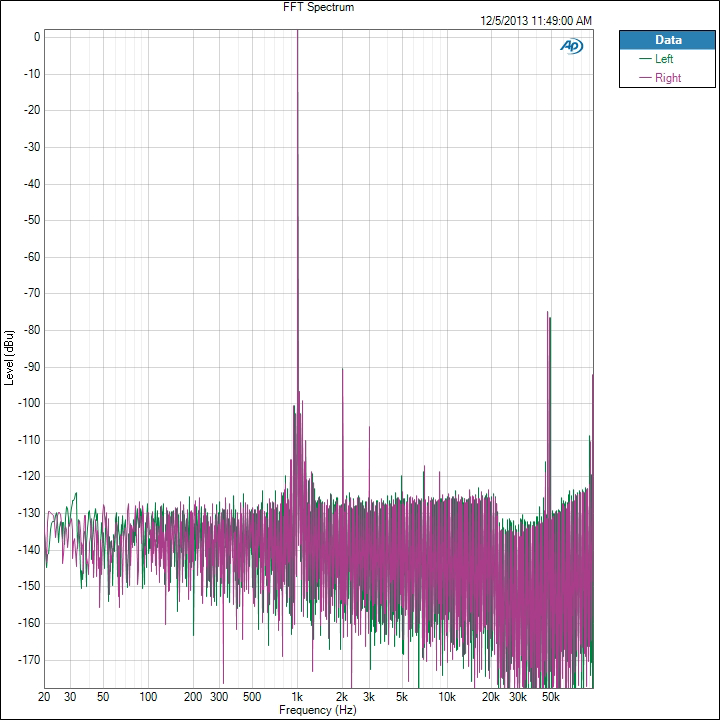
There is a 2 kHz peak that is -93 dB below the fundamental frequency, and the 3rd harmonic at 3 kHz is over -109 dB below it. All the harmonics past that are at -120 dB below the fundamental tone. There is some noise out at 50 kHz but this is so far past the level of human hearing that it is safely ignored. Now the Nexus 5 FFT.
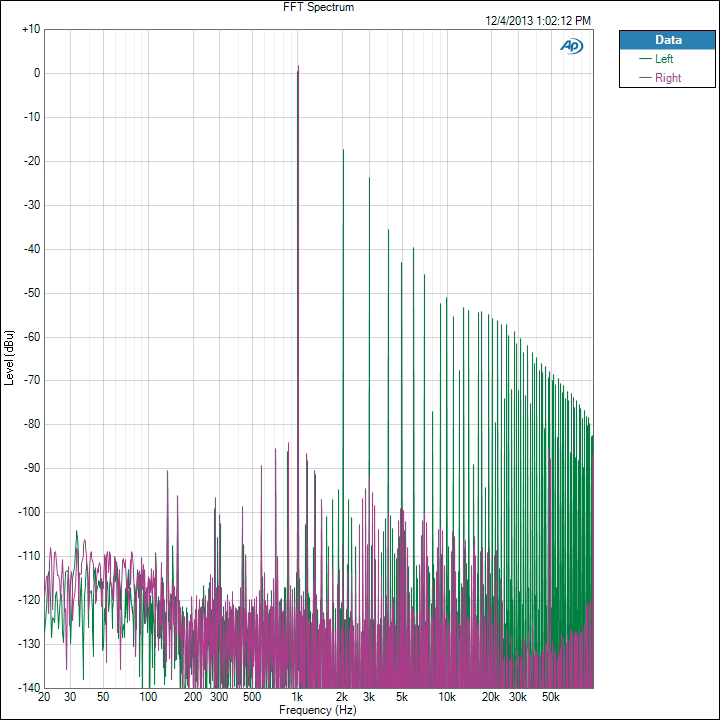
We see the right channel, which didn’t clip, looks good. The 2nd harmonic is -111 dB and the 3rd harmonic is -93 dB. On the left channel the 2nd harmonic is only -18 dB and the 3rd harmonic is -24 dB. Even at the 9th harmonic we are still only -52 dB below the fundamental tone. This is causing these incredibly high THD+N numbers that we are seeing on the Nexus 5. We will see more detail of this on a later test as well.
We also chart THD+N vs. Frequency. Here is the chart for the Note 3.
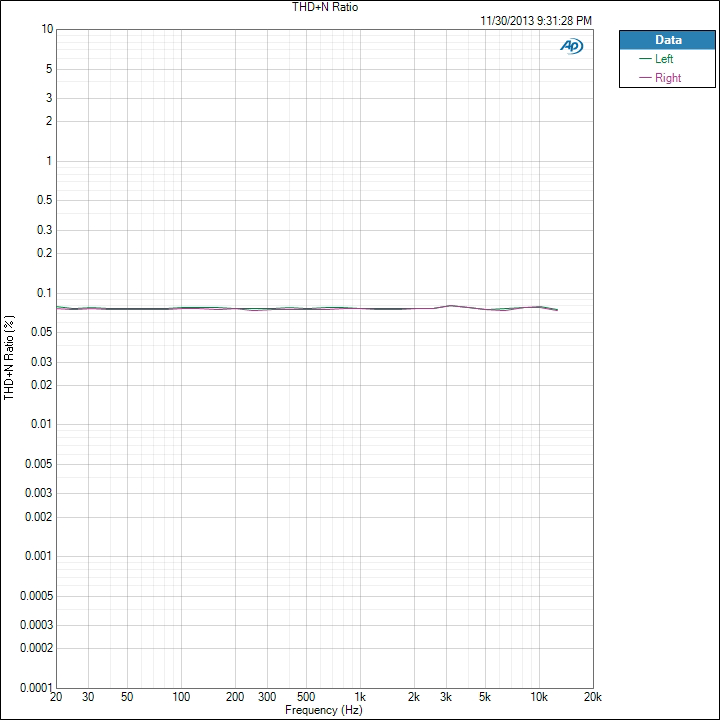
We see that THD+N is basically right below 0.08% for the whole spectrum. It moves up and down slightly, but is very constant. Now here is that Nexus 5 data.
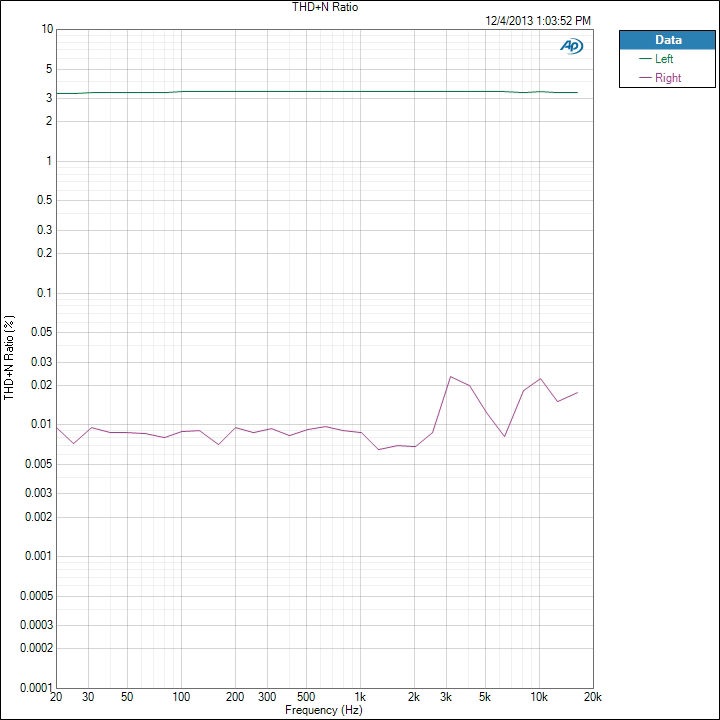
We see that the right channel is around 0.01% THD+N while the left channel, the clipped one, is over 3%. If we ran the Nexus 5 at a lower volume level we would see totally different results, as you’ll find out later, but this is how devices are typically measured.


188 Comments
View All Comments
dylan522p - Sunday, December 8, 2013 - link
The One is very interesting in terms of quality. There is a huge difference between the stock music, google play music, power amp, and astro. Astro is the best quality.Impulses - Monday, December 9, 2013 - link
You know, you briefly alluded to the single biggest difference maker and a ton of people would still take it for granted... If you're using crappy headphones much of this is wholly irrelevant. At the same time, expensive headphones aren't always an upgrade... For one thing you've got the Beats and Bose of the world getting by on marketing, and even beyond that not every headphone will be a good match to any given phone depending on how hard to drive it is (or isn't) and how out of whack the phone's output impedance is (something that's often taken for granted even with dedicated audio components).Daniel Egger - Sunday, December 8, 2013 - link
I always thought the reference for audio testing equipment, especially in telecommunications, was HEAD acoustics. Still a good and interesting article.Drumsticks - Sunday, December 8, 2013 - link
Jeez Anandtech rocks. Thanks guys!RoninX - Sunday, December 8, 2013 - link
Great! This is exactly what I've been waiting for.I've noticed the audio quality on my Droid 4 is sufficiently poor that I continue to carry around an iPod Classic along with the D4. I'm hoping that the sound quality on my next phone, likely either a Note 3 or the next gen HTC One (One Two?), will be good enough that this isn't necessary.
pukemon1976 - Sunday, December 8, 2013 - link
2 thumbs up for galaxy note 3 audio quality. was quite surprised.dylan522p - Sunday, December 8, 2013 - link
One definely. The internal amp adds tons to quality the Two or whatever it is called will assuradly be even better.quick brown fox - Sunday, December 8, 2013 - link
As a mild audiophile who occasionally searches for electrical measurements of DAPs/smartphones on IF/GE/GSMA/Voldemort's Blog/etc, I am very pleased seeing this article in Anandtech! Had a mild laugh seeing the HTC One 'Beats Enabled' frequency response (is the treble peak still there without Beats?), and I'm very much looking forward to seeing some Nvidia Shield/SIII i9300 measurements.cheinonen - Sunday, December 8, 2013 - link
With Beats disabled, you actually see a bit of a roll-off in the bass and the treble. It's +/- 0.230 dB so not a level you'll likely hear. Overall the response is very flat if you turn off Beats. I'm still testing something else I found with the HTC One before I have full numbers up there.quick brown fox - Sunday, December 8, 2013 - link
Thanks. Again, this article is excellent; looking forward for more measurements!