Battle of the 4 TB NAS Drives: WD Red and Seagate NAS HDD Face-Off
by Ganesh T S on September 4, 2013 6:00 AM EST- Posted in
- NAS
- Seagate
- HDDs
- Western Digital
- Enterprise
Performance - Raw Drives
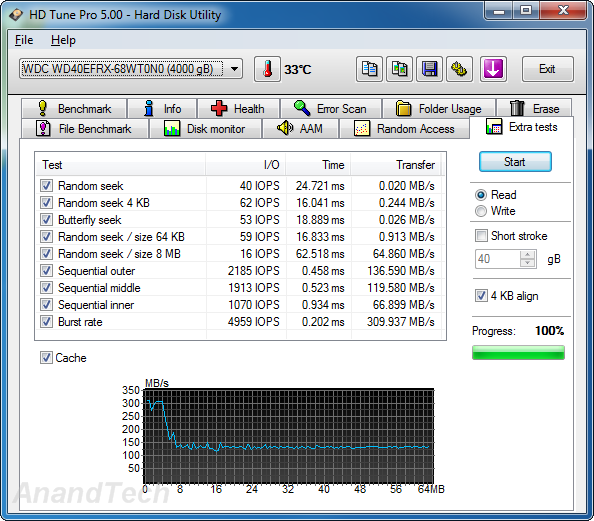
Prior to evaluating the performance of the drives in a NAS environment, we wanted to check up on the best-case performance of the drives by connecting them directly to a SATA 6 Gbps port. Using HD Tune Pro 5.0, we ran a number of tests on the raw drives. The following screenshots present the results for the various drives in an easy-to-compare manner.
Sequential Reads
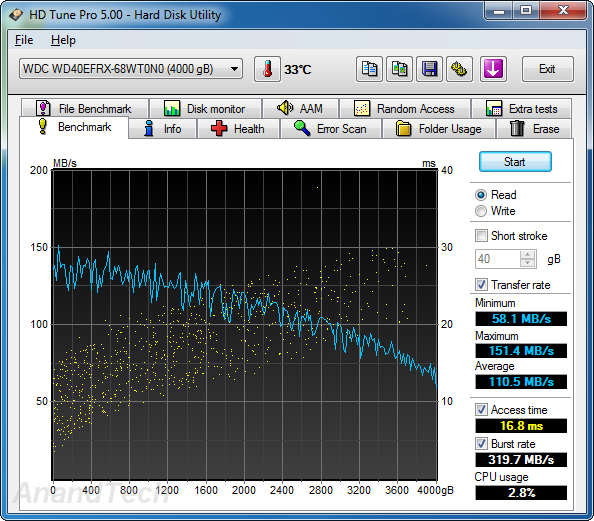
The WD Se and WD Re drives, as expected, lead the benchmark numbers with an average transfer rate of around 136 MBps. The Seagate unit (135 MBps) performs better than the WD Red (111 MBps) in terms of raw data transfer rates, thanks to the higher rotational speed. However, the burst rate of the Seagate NAS HDD is much lower than that of the WD Red. This is probably because the DDR2 memory used in the WD drives is clocked higher than the one in the NAS HDD.
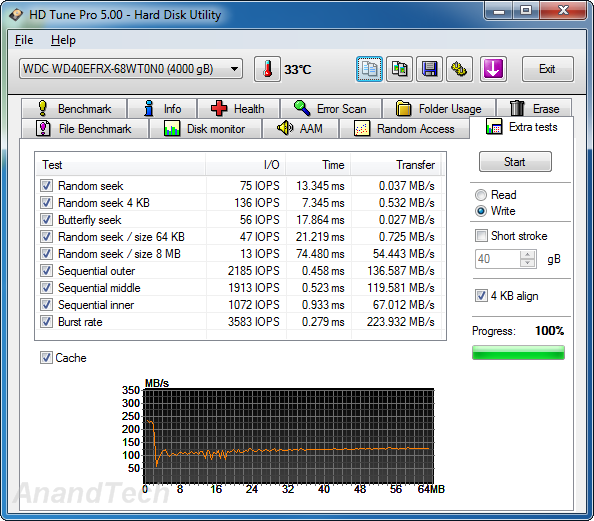
Sequential Writes
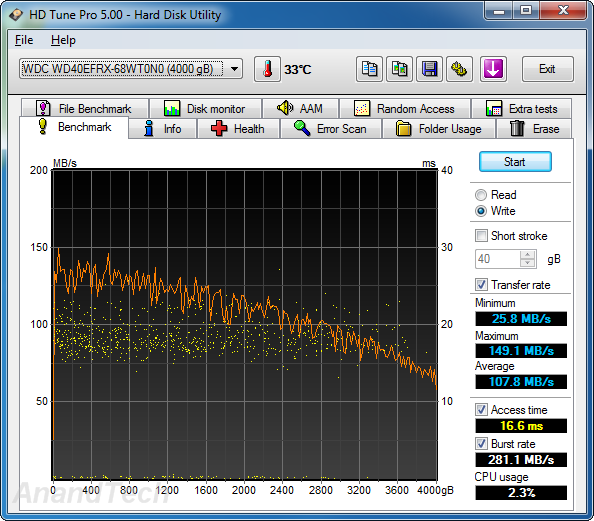
A similar scenario plays out in the sequential write benchmarks. The WD Re leads the pack with an average transfer rate of 135 MBps and the WD Se follows close behind at 133 MBps. The WD Red comes in at 108 MBps and the Seagate NAS HDD clocks in at 131 MBps. The on-board cache in the WD series is faster than that on the Seagate unit, leading to better burst rates.
Random Reads
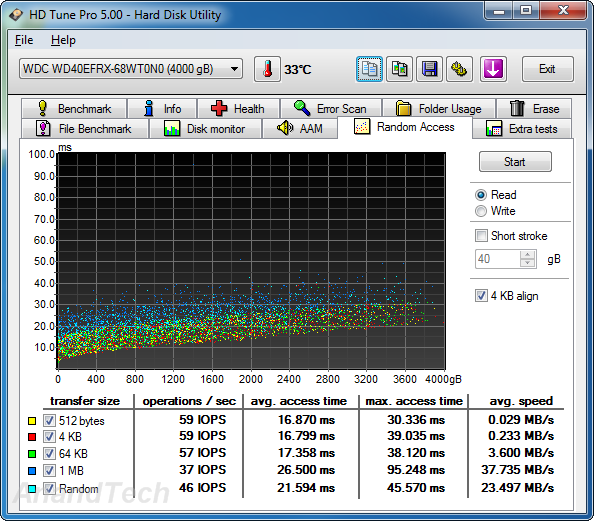
In the random read benchmarks, the WD Red and Seagate NAS HDD perform fairly similar to each other in terms of IOPS as well as average access time. The WD Re edges out the WD Se despite similar rotational speeds and platter structure.
Random Writes
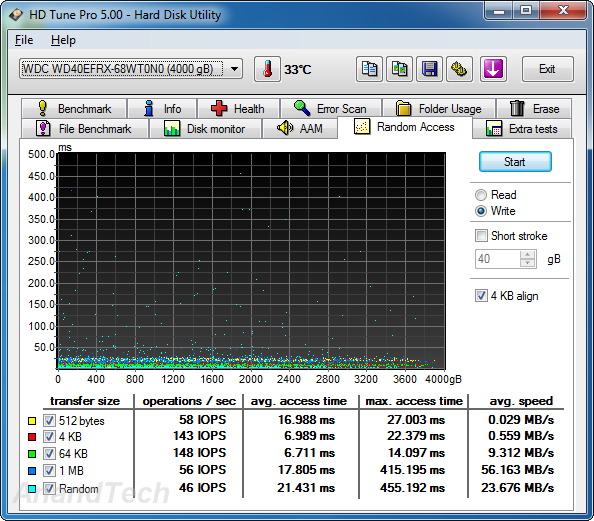
The differences between the enterprise-class drives and the consumer / SOHO NAS drives is even more pronounced in the random write benchmark numbers. The Seagate NAS HDD loses out in terms of both IOPS and average access time to the WD Red. WD Re and WD Se perform much better in this scenario.
Miscellaneous Reads
HD Tune Pro also includes a suite of miscellaneous tests such as random seeks and sequential accesses in different segments of the hard disk platters. The numbers above show the WD Red and Seagate NAS HDD matched much more evenly with the NAS HDD emerging slightly better in quite a few of the tests. The cache effects are also visible in the final graph.
Miscellaneous Writes
Similar to the previous sub-section, we find that the WD Red edges out the Seagate NAS HDD in the 4KB random seek test, but loses out in a majority of the other tests which are heavily influenced by the rotational speed.
We now have an idea of the standalone performance of the four drives being considered today. In the next section, we will take a look at the performance of these drives when placed inside a typical SOHO / consumer NAS.


54 Comments
View All Comments
joelypolly - Wednesday, September 4, 2013 - link
With a difference of 1 to 2 watts for the Seagate I fail to see how that would be too much of a cause for concern for cooling systems? Even with a 5 disk array it should still be under 10 watts difference in the most demanding circumstances and about 5 watts on average.owan - Wednesday, September 4, 2013 - link
I was thinking about that. 1W difference has got to be negligible for any desktop based system. Even 3-4W differences, while large on the relative scale, are small in the absolute sense. I don't see how you could make the statement "if you want more performance, Seagate, if you need cool and quiet, WD" Is there no other reason to pick one drive over the other besides a 1W performance consumption difference?glugglug - Wednesday, September 4, 2013 - link
It is hard to see the relative differences quickly switching between the performance graphs for the different drives because some of them are on different scales for each drive. Is there any way the graph scales can be made uniform?ganeshts - Wednesday, September 4, 2013 - link
Can you let me know the specific graphs you are seeing the problem in? The numbers are also reported by HD Tune Pro on the side..glugglug - Wednesday, September 4, 2013 - link
The random read and random write graphs.I can see the scale on the side, but for example the random read graph has the max Y scale value at 50ms for the WD SE drive, 100ms for the Red drive and WD RE and 200 ms for the Seagate. At first glance, it looks like the Seagate is owning because of the scale -- it requires extra thought to figure out what the graph would look like on the same scale for comparison.
ganeshts - Wednesday, September 4, 2013 - link
Got it. From what I remember, HD Tune Pro doesn't give user control over graph scales. But, I will see what can be done for future articles.ZRohlfs - Wednesday, September 4, 2013 - link
If you look closely at those graphs you can see some outliers that are very high on the graph. They are away from the statistical clump but they cause the graph to have the scales that they do.carlwu - Wednesday, September 4, 2013 - link
Can anyone comment on Seagate reliability as of late? Their 1TB drive fiasco left a bad taste my mouth.dawza - Wednesday, September 4, 2013 - link
The Seagate NAS HDDs seem quite good in terms of reliability thus far. I have a 3 TB and 4 TB in my WHS (JBOD) and they've made it past the crucial 1 month mark without issues. But as mentioned in the review, these haven't been on the market very long.These are the first Seagates I've purchased in years due to past issues you alluded to.
RealBeast - Thursday, September 5, 2013 - link
Carlwu, I had that thought also but set up one NAS with 8 x 3TB Seagate 7200rpm (the ST3000DM001) in RAID 6 and have had no issues for the six months they have run 24/7. Fingers crossed.