Samsung SSD 840 EVO Review: 120GB, 250GB, 500GB, 750GB & 1TB Models Tested
by Anand Lal Shimpi on July 25, 2013 1:53 PM EST- Posted in
- Storage
- SSDs
- Samsung
- TLC
- Samsung SSD 840
AnandTech Storage Bench 2011
Two years ago we introduced our AnandTech Storage Bench, a suite of benchmarks that took traces of real OS/application usage and played them back in a repeatable manner. I assembled the traces myself out of frustration with the majority of what we have today in terms of SSD benchmarks.
Although the AnandTech Storage Bench tests did a good job of characterizing SSD performance, they weren't stressful enough. All of the tests performed less than 10GB of reads/writes and typically involved only 4GB of writes specifically. That's not even enough exceed the spare area on most SSDs. Most canned SSD benchmarks don't even come close to writing a single gigabyte of data, but that doesn't mean that simply writing 4GB is acceptable.
Originally I kept the benchmarks short enough that they wouldn't be a burden to run (~30 minutes) but long enough that they were representative of what a power user might do with their system.
Not too long ago I tweeted that I had created what I referred to as the Mother of All SSD Benchmarks (MOASB). Rather than only writing 4GB of data to the drive, this benchmark writes 106.32GB. It's the load you'd put on a drive after nearly two weeks of constant usage. And it takes a *long* time to run.
1) The MOASB, officially called AnandTech Storage Bench 2011 - Heavy Workload, mainly focuses on the times when your I/O activity is the highest. There is a lot of downloading and application installing that happens during the course of this test. My thinking was that it's during application installs, file copies, downloading and multitasking with all of this that you can really notice performance differences between drives.
2) I tried to cover as many bases as possible with the software I incorporated into this test. There's a lot of photo editing in Photoshop, HTML editing in Dreamweaver, web browsing, game playing/level loading (Starcraft II & WoW are both a part of the test) as well as general use stuff (application installing, virus scanning). I included a large amount of email downloading, document creation and editing as well. To top it all off I even use Visual Studio 2008 to build Chromium during the test.
The test has 2,168,893 read operations and 1,783,447 write operations. The IO breakdown is as follows:
| AnandTech Storage Bench 2011 - Heavy Workload IO Breakdown | ||||
| IO Size | % of Total | |||
| 4KB | 28% | |||
| 16KB | 10% | |||
| 32KB | 10% | |||
| 64KB | 4% | |||
Only 42% of all operations are sequential, the rest range from pseudo to fully random (with most falling in the pseudo-random category). Average queue depth is 4.625 IOs, with 59% of operations taking place in an IO queue of 1.
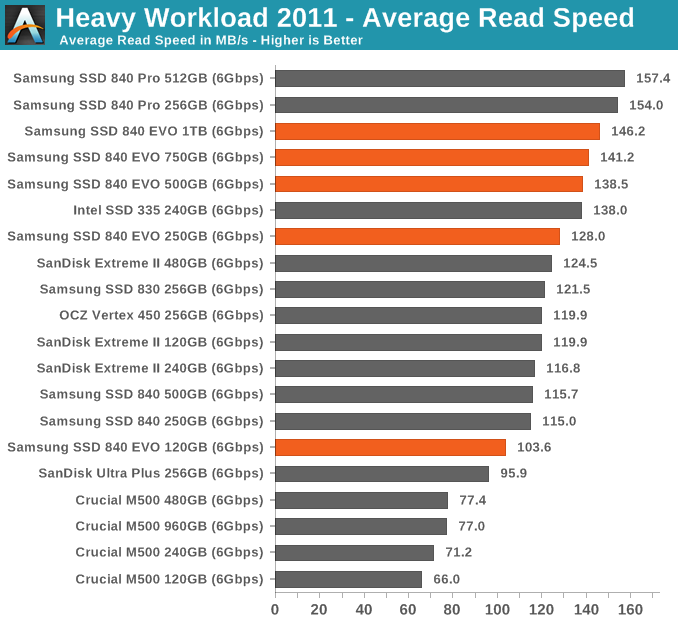
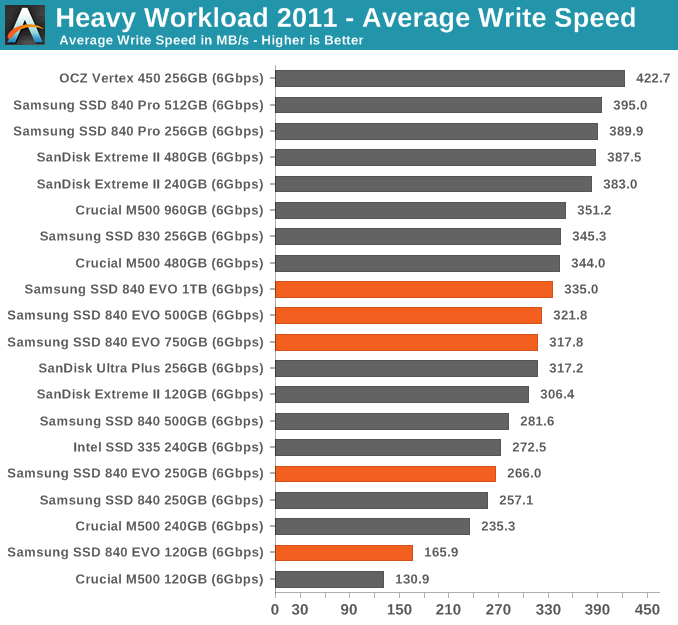
Many of you have asked for a better way to really characterize performance. Simply looking at IOPS doesn't really say much. As a result I'm going to be presenting Storage Bench 2011 data in a slightly different way. We'll have performance represented as Average MB/s, with higher numbers being better. At the same time I'll be reporting how long the SSD was busy while running this test. These disk busy graphs will show you exactly how much time was shaved off by using a faster drive vs. a slower one during the course of this test. Finally, I will also break out performance into reads, writes and combined. The reason I do this is to help balance out the fact that this test is unusually write intensive, which can often hide the benefits of a drive with good read performance.
There's also a new light workload for 2011. This is a far more reasonable, typical every day use case benchmark. Lots of web browsing, photo editing (but with a greater focus on photo consumption), video playback as well as some application installs and gaming. This test isn't nearly as write intensive as the MOASB but it's still multiple times more write intensive than what we were running in 2010.
As always I don't believe that these two benchmarks alone are enough to characterize the performance of a drive, but hopefully along with the rest of our tests they will help provide a better idea.
The testbed for Storage Bench 2011 has changed as well. We're now using a Sandy Bridge platform with full 6Gbps support for these tests.
AnandTech Storage Bench 2011 - Heavy Workload
We'll start out by looking at average data rate throughout our new heavy workload test:
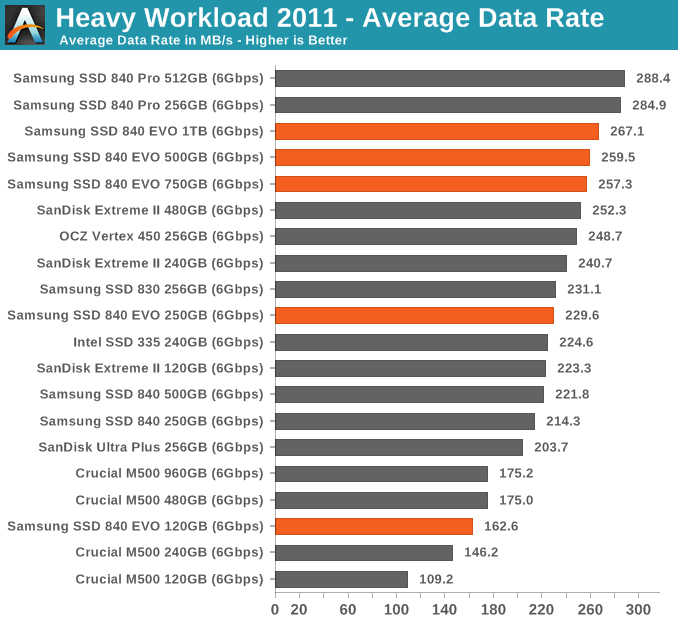
In lighter workloads than our 2013 workload the EVO still does incredibly well.
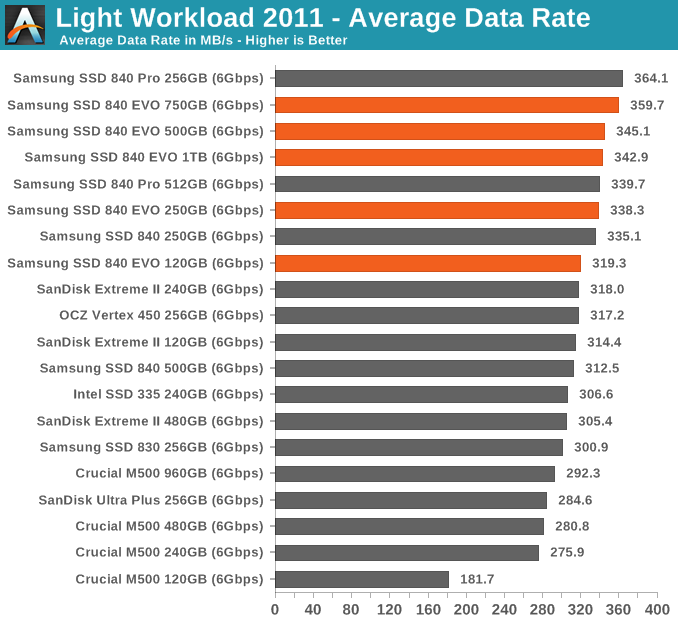
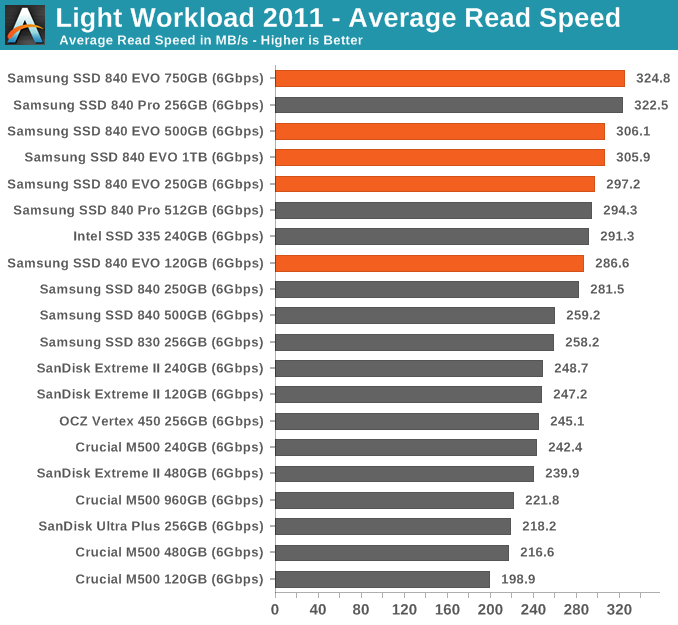
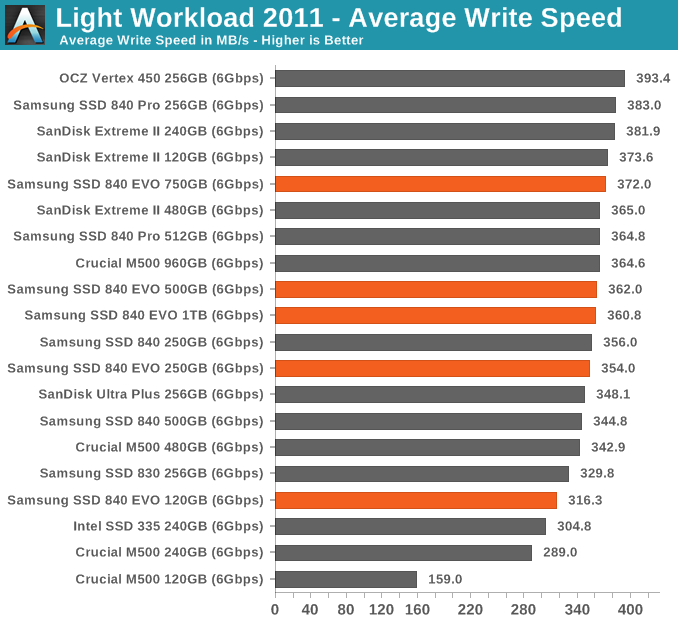
AnandTech Storage Bench 2011 - Light Workload
Our new light workload actually has more write operations than read operations. The split is as follows: 372,630 reads and 459,709 writes. The relatively close read/write ratio does better mimic a typical light workload (although even lighter workloads would be far more read centric).
The I/O breakdown is similar to the heavy workload at small IOs, however you'll notice that there are far fewer large IO transfers:
| AnandTech Storage Bench 2011 - Light Workload IO Breakdown | ||||
| IO Size | % of Total | |||
| 4KB | 27% | |||
| 16KB | 8% | |||
| 32KB | 6% | |||
| 64KB | 5% | |||


137 Comments
View All Comments
MVR - Thursday, November 14, 2013 - link
It will be very interesting when they start loading these up with more than 512MB of DRAM cache. Imagine a drive with 4-8+ GB on board. The response times would be insane. It is only a matter of time considering you can buy 8GB of SODIMM memory for $70. They could probably put it on board for $50 added cost to the drive - then these would truly act like PCIe SSD cards, except it would totally max out the SATA3 throughput limit.MVR - Thursday, November 14, 2013 - link
Of course SATA revision 3.2 at 16gbit/sec would sure enjoy it. Imagine a pair of those in RAID 0 :)Wao - Sunday, November 24, 2013 - link
I'm going to change my old noisy hard disk with a Samsung 840 EVO 1TB model. I am wondering if I really need to enable TRIM in OS X. I check the data sheet. It only said "Yes" about garbage collection and TRIM support. Does it meant that this model has its own garbage collection built-in, or I really need to enable TRIM in OS X. Honestly, I don't like to hack around the system files.Thanks !
iradel - Monday, November 25, 2013 - link
In the "IMFT vs. Samsung NAND Comparison" table, how did you get a Pages per Block value of 256 for 19nm TLC (a.k.a. the 840 EVO)? 8KB * 256 pages per block would imply an erase block size of 2048KB, whereas I've read that the 840 EVO has an EBS of 1536KB (which would mean 192 pages per block).Where did you get the 256 value?
sambrightman - Sunday, September 20, 2015 - link
I have the same question. I've read both the 840 and 840 EVO have 1536KiB EBS due to TLC, this is the only place saying 2MiB. Did you find an answer?Scraps - Tuesday, November 26, 2013 - link
What would be the optimum configuration for this situation. A MacBook Pro with 2 samsung evo 1tb. Would striped raid zero be the best ?code42 - Wednesday, December 18, 2013 - link
Can I use the Samsung 840 Pro 1TB with a NAS solution? Can some propose a nice setup? ThanksHal9009 - Wednesday, December 18, 2013 - link
Just received my new ASUS N550JV and updated the slow HD with 840 EVO-Series 750GB SSD, 16GB of G.SKILL 16GB (2 x 8G) 204-Pin DDR3 and a fresh copy of win-7x64...could not be happier, Samsung makes great SSDs7beauties - Saturday, December 28, 2013 - link
I bought the Samsung 840 EVO 1TB because Maximum PC gave it a 9 Kick *ss award, but they described it as being MLC. Good ole Anand tells it like it is. This is TLC. I was pretty steamed with Samsung because they describe this as their "new 3 bit MLC NAND," which I wouldn't have bought over Crucial's M500 960GB MLC SSD. Though Anand tries to calm fears of TLC's endurance, I can't understand what a "GiB" is and how I can calculate my drive's life span.verjic - Thursday, February 13, 2014 - link
I have a question. In some of the tests I found of real life use shows that Kingston V300 and Samsung a practically the same speed and even at copy 2 GB of 26000 files is slowly on samsung with about 30 %!!! Also installing a program like photoshop, takes longer on Samsung than Kingston, difference is not so big but is arou 10-15 %. Why is that? From all the test for kingston and Samsung, everyone say that Samsung is better but I don't see how? If anyone can explain to me, please