Intel SSD DC S3500 Review (480GB): Part 1
by Anand Lal Shimpi on June 11, 2013 6:10 PM EST- Posted in
- Storage
- IT Computing
- SSDs
- Intel
- Datacenter
- Enterprise
Performance Consistency
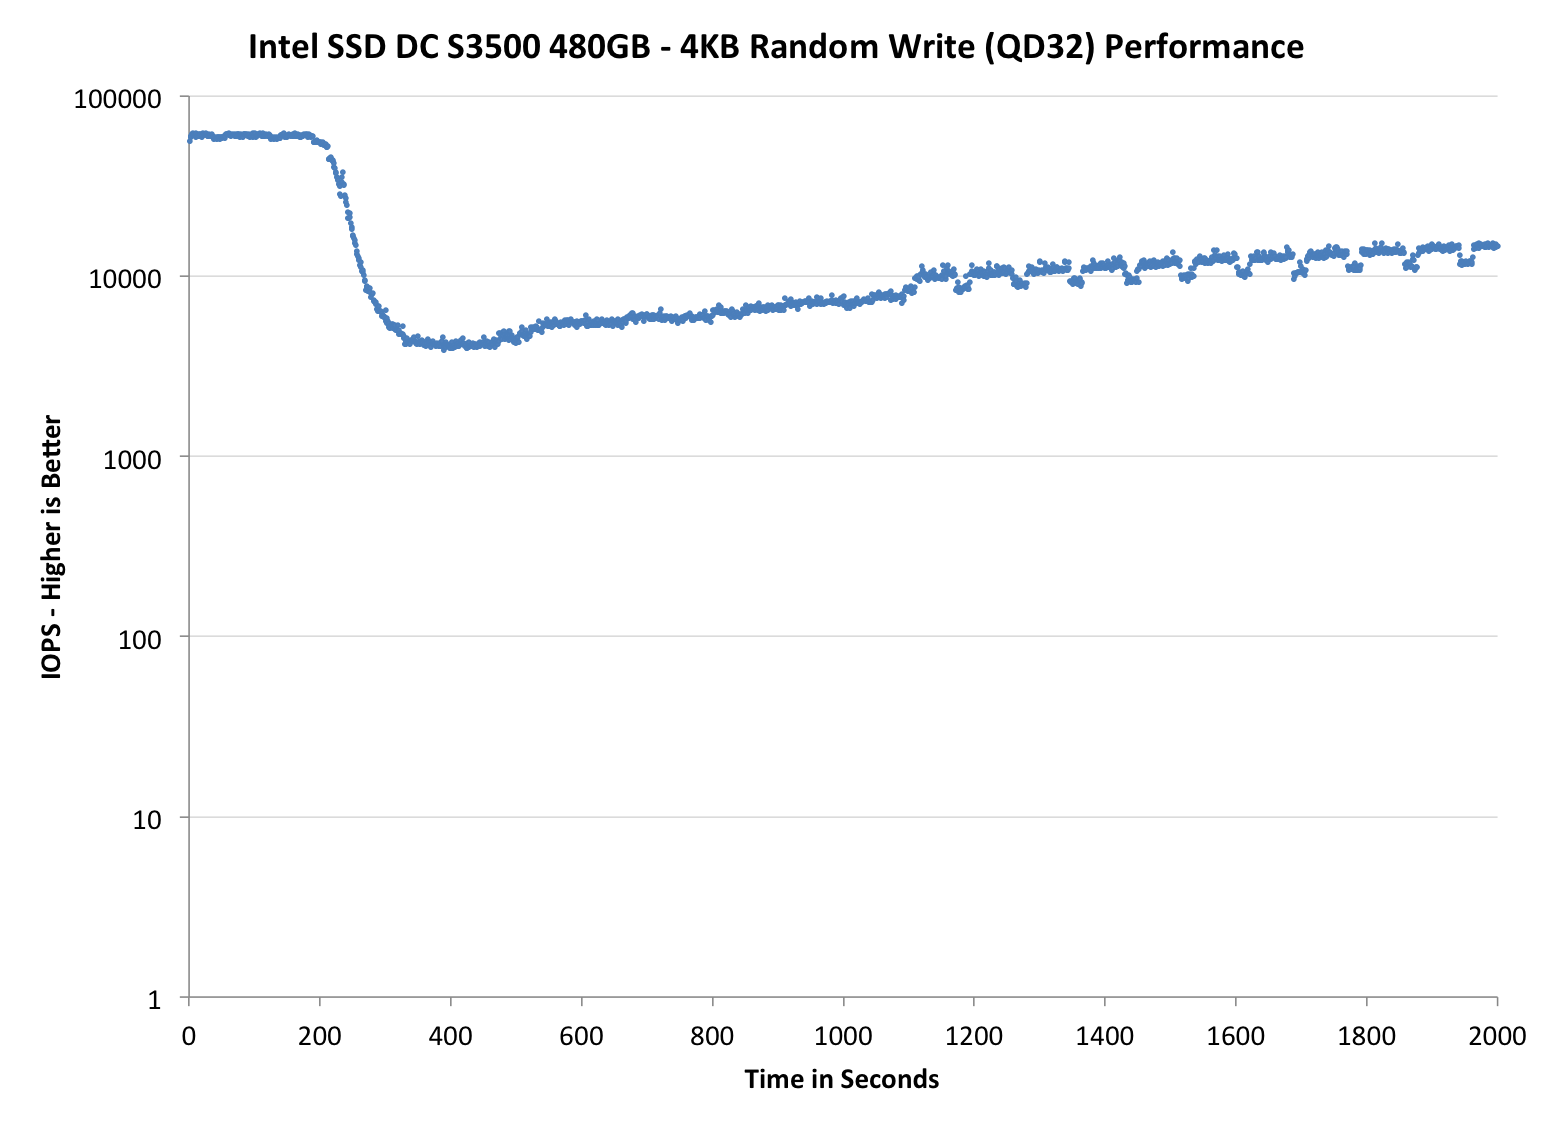
In our Intel SSD DC S3700 review I introduced a new method of characterizing performance: looking at the latency of individual operations over time. The S3700 promised a level of performance consistency that was unmatched in the industry, and as a result needed some additional testing to show that. The reason we don't have consistent IO latency with SSDs is because inevitably all controllers have to do some amount of defragmentation or garbage collection in order to continue operating at high speeds. When and how an SSD decides to run its defrag and cleanup routines directly impacts the user experience. Frequent (borderline aggressive) cleanup generally results in more stable performance, while delaying that can result in higher peak performance at the expense of much lower worst case performance. The graphs below tell us a lot about the architecture of these SSDs and how they handle internal defragmentation.
To generate the data below I took a freshly secure erased SSD and filled it with sequential data. This ensures that all user accessible LBAs have data associated with them. Next I kicked off a 4KB random write workload across all LBAs at a queue depth of 32 using incompressible data. I ran the test for just over half an hour, no where near what we run our steady state tests for but enough to give me a good look at drive behavior once all spare area filled up.
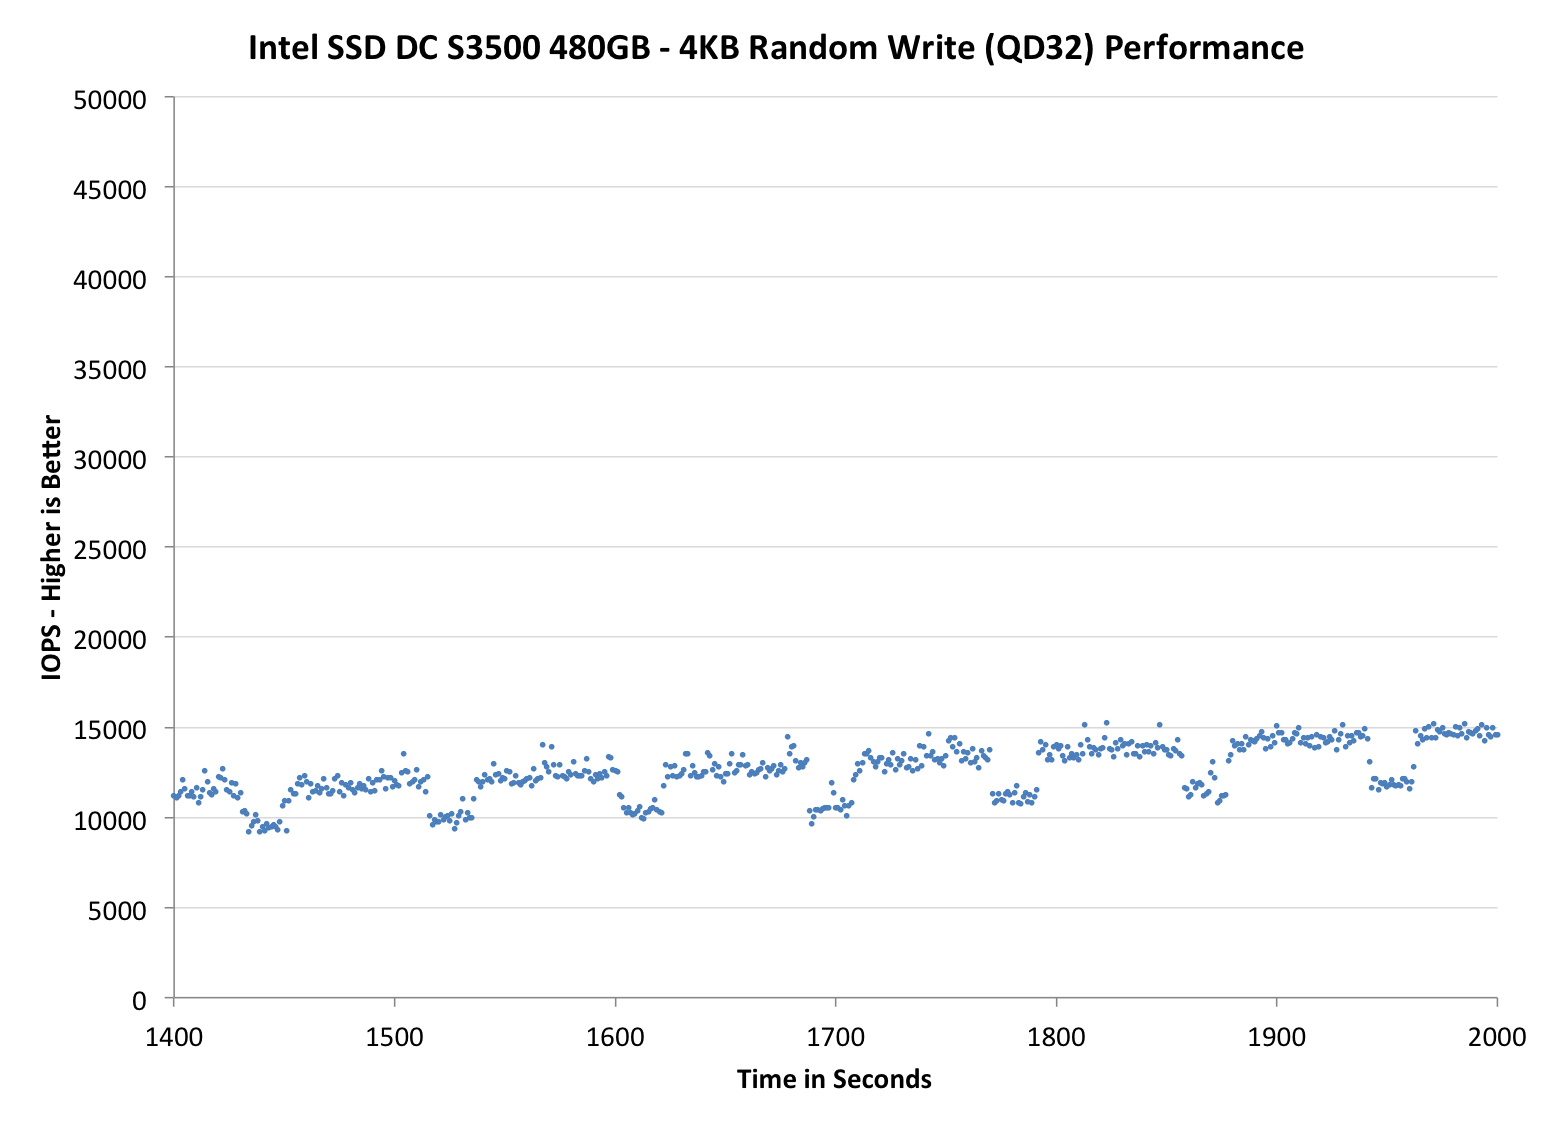
I recorded instantaneous IOPS every second for the duration of the test. I then plotted IOPS vs. time and generated the scatter plots below. Each set of graphs features the same scale. The first two sets use a log scale for easy comparison, while the last set of graphs uses a linear scale that tops out at 50K IOPS for better visualization of differences between drives.
The high level testing methodology remains unchanged from our S3700 review. Unlike in previous reviews however, I did vary the percentage of the drive that I filled/tested depending on the amount of spare area I was trying to simulate. The buttons are labeled with the advertised user capacity had the SSD vendor decided to use that specific amount of spare area. If you want to replicate this on your own all you need to do is create a partition smaller than the total capacity of the drive and leave the remaining space unused to simulate a larger amount of spare area. The partitioning step isn't absolutely necessary in every case but it's an easy way to make sure you never exceed your allocated spare area. It's a good idea to do this from the start (e.g. secure erase, partition, then install Windows), but if you are working backwards you can always create the spare area partition, format it to TRIM it, then delete the partition. Finally, this method of creating spare area works on the drives we've tested here but not all controllers may behave the same way.
The first set of graphs shows the performance data over the entire 2000 second test period. In these charts you'll notice an early period of very high performance followed by a sharp dropoff. What you're seeing in that case is the drive allocating new blocks from its spare area, then eventually using up all free blocks and having to perform a read-modify-write for all subsequent writes (write amplification goes up, performance goes down).
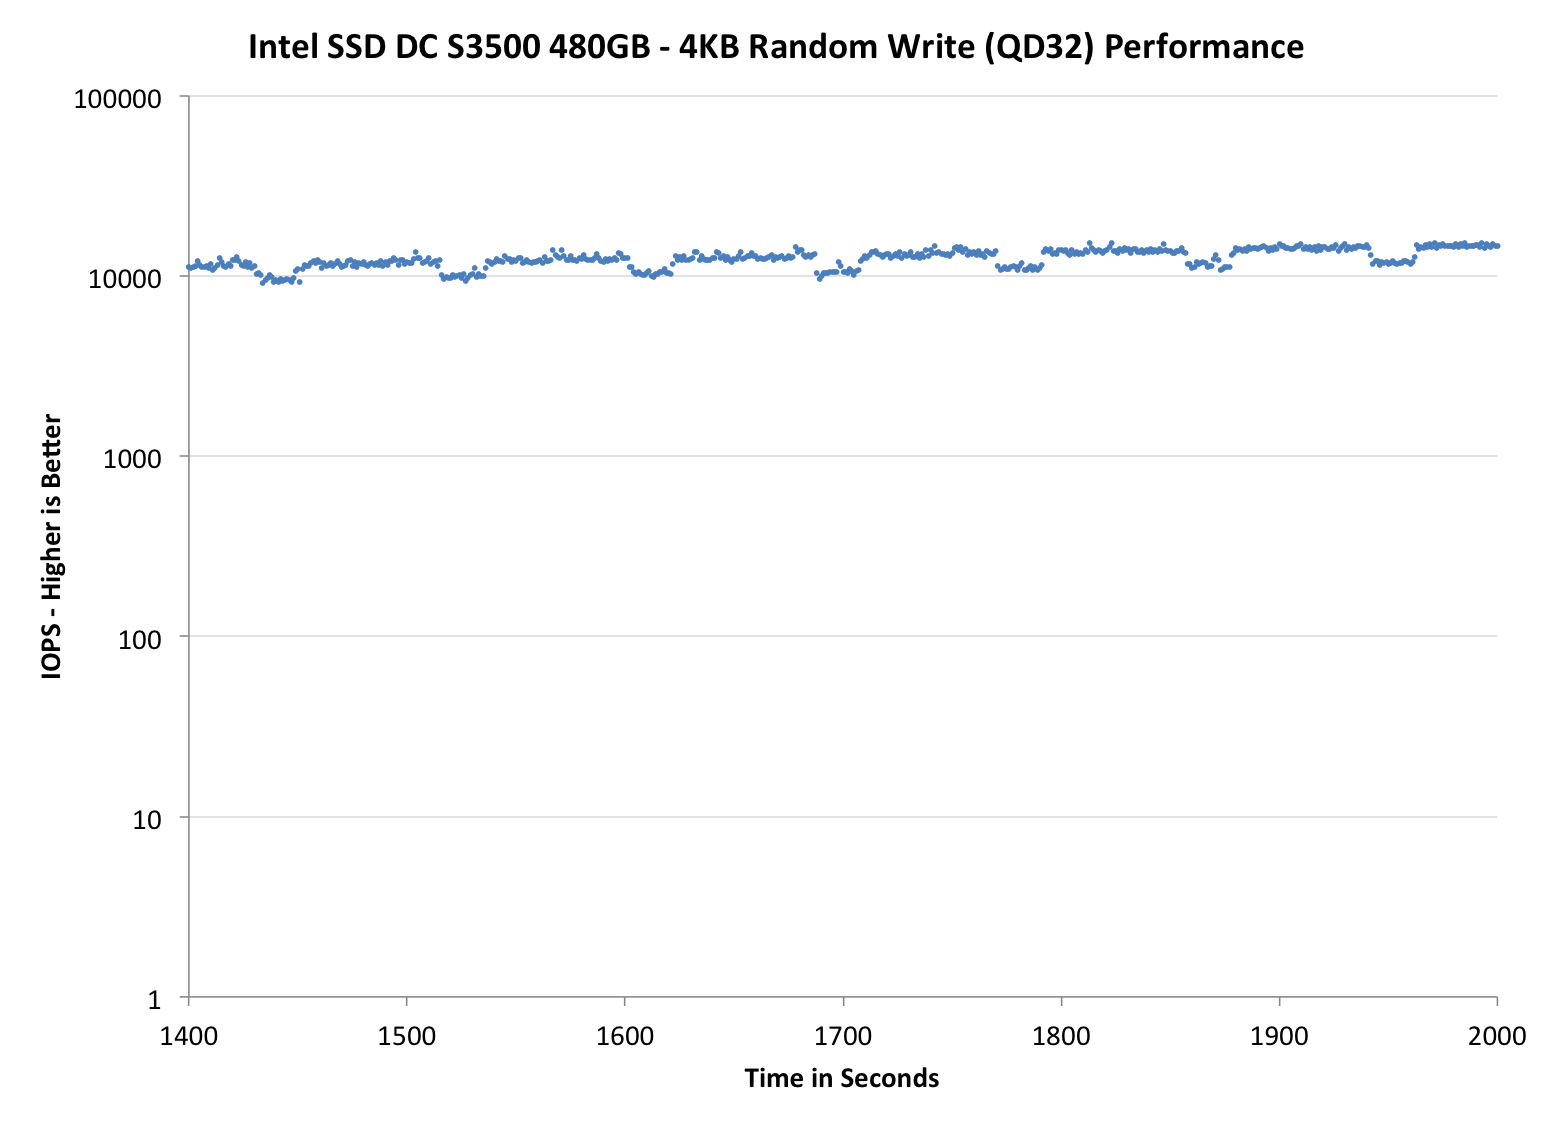
The second set of graphs zooms in to the beginning of steady state operation for the drive (t=1400s). The third set also looks at the beginning of steady state operation but on a linear performance scale. Click the buttons below each graph to switch source data.
 |
|||||||||
| Intel SSD DC S3500 480GB | Intel SSD DC S3700 200GB | Seagate 600 Pro 400GB | |||||||
| Default | |||||||||
While it's not quite as pretty of a curve as what we saw with the S3700, the two drives are clearly related. Intel's SSD DC S3500 delivers incredibly predictable performance. The biggest take away is that Intel is able to still deliver good performance consistency even with much less NAND spare area than on the S3700. Architecture enables what we see here, not just spare area.
 |
|||||||||
| Intel SSD DC S3500 480GB | Intel SSD DC S3700 200GB | Seagate 600 Pro 400GB | |||||||
| Default | |||||||||
Remember this predictable little pattern? The periodic dips in performance are Intel's defrag/GC routines operating at regular (and frequent) intervals. You'll also notice the slight upward trend here; the S3500 is looking to improve its performance over time, even under heavy load, without sacrificing consistency.
 |
|||||||||
| Intel SSD DC S3500 480GB | Intel SSD DC S3700 200GB | Seagate 600 Pro 400GB | |||||||
| Default | |||||||||
This zoomed in view really gives us great perspective as to what's going on. I included comparable data from other drives in the S3700 review, but the size/scales of those charts made inclusion here not possible in short form.


54 Comments
View All Comments
Minion4Hire - Tuesday, June 11, 2013 - link
I believe that's just the writes they guarantee the drive for. There's write amplification and maintenance to consider there as well.ShieTar - Wednesday, June 12, 2013 - link
Well, they have to keep the S3700 useful enough to sell both. So they tailor the specs a bit in order to push customers into buying the "right" drive.ShieTar - Wednesday, June 12, 2013 - link
Then again, if this is guaranteed for the whole range, its an impressive number for the small 80GB drive.pesos - Tuesday, June 11, 2013 - link
How about performance over time in virtualization scenarios? Wondering how well these SSDs hold up when they have nothing on them but virtual hard disks...dealcorn - Tuesday, June 11, 2013 - link
In Part 2, could you kindly note whether the Drive supports DEVSLP. Depending on usage pattern, not considering the drive for mobile use based on idle power requirements may be inappropriate.sunbear - Tuesday, June 11, 2013 - link
Looking at the consistency comparison against the seagate 600 pro, it looks like the intel s3500 is more consistent but unfortunately it's consistently slower in every metric. I'd rather have a seagate 600 pro with inconsistent performance if the minimum performance if that drive is better than the maximum performance of the s3500.beginner99 - Wednesday, June 12, 2013 - link
I had the same thought. agree.hrrmph - Friday, June 14, 2013 - link
As an individual drive maybe.For RAID, the slowest drive in the array will probably control the overall I/O rate. In that case, I don't see an advantage for Seagate over Intel.
As I see it, the S3500 is a pro-sumer high-end workstation drive for RAID arrays, and a mid-range enterprise class drive. The S3700 is clearly a full-on high-end enterprise class drive.
We'll have to wait for Part 2 of the article and hope that Anand gives us some comparisons to the consumer 520 series to see if there is any reason to buy an S3500 instead of a 520.
Intel is being suspiciously quiet about the upcoming 530 series SSDs. I expect that we'll be looking at another low power consumption, high performance, relatively affordable SSD using a non-Intel controller. But, it would be nice if we could have all of that with an Intel controller instead.
-
rs2 - Wednesday, June 12, 2013 - link
What's the deal with the first slide from Intel shown in the conclusion? Specifically, how is a 12x800GB (9.6 TB) deployment comparable to a 500x300GB (150 TB) deployment?The only way you can get 500 VM's on such a deployment is if you allocate only ~20 GB per VM. That's anemic. And if that's the allocation size then the 500x300GB can support over 7500 VM's.
So...yeah, not seeing how a valid comparison is being made. Intel should be quoting figures based upon ~192 SSD's, because that's how many it takes to reach the same storage capacity as the solution it's being compared to.
flyingpants1 - Wednesday, June 12, 2013 - link
I noticed the same thing.