NVIDIA GeForce GTX 650 Ti Boost Review: Bringing Balance To The Force
by Ryan Smith on March 26, 2013 8:00 AM ESTPower, Temperature, & Noise
Last but not least of course is our look at power, temperature, and noise. Because the GTX 650 Ti Boost is essentially a reconfigured GTX 660 there aren’t going to be any grand revelations here, but it will be useful to figure out just what the real-world power savings will be from fusing off that one SMX.
| GeForce GTX 650 Ti Boost Voltages | ||||
| Ref GTX 650 Ti Boost Idle | Ref GTX 650 Ti Boost Load | Ref GTX 660 Load | ||
| 0.887v | 1.175v | 1.175v | ||
With a peak load voltage of 1.175v, the GTX 650 Ti Boost tops out at the same voltage as the rest of the boost-enabled Kepler family.
Up next, before we jump into our graphs let’s take a look at the average core clockspeed during our benchmarks. Because GTX 650 Ti Boost has the same TDP has the GTX 660 but at least marginally lower power consumption due to the disabled SMX, it’s in an interesting position where it has more headroom for boosting than its fully-enabled counterpart. As a result we’re seeing far less variability than what we saw with the GTX 660 when we reviewed it last year. With the exception of BF3, every game is sustained at the top boost bin of 1071MHz. Based on these results it would appear that in practice the GTX 650 Ti Boost operates at a marginally higher average clockspeed than the otherwise superior GTX 660.
| GeForce GTX 650 Ti Boost Average Clockspeeds | |||
| Max Boost Clock | 1071MHz | ||
| DiRT:S |
1071MHz
|
||
| Shogun 2 |
1071MHz
|
||
| Hitman |
1071MHz
|
||
| Sleeping Dogs |
1071MHz
|
||
| Crysis |
1071MHz
|
||
| Far Cry 3 |
1071MHz
|
||
| Battlefield 3 |
1058MHz
|
||
| Civilization V |
1071MHz
|
||
| FurMark | 992MHz | ||
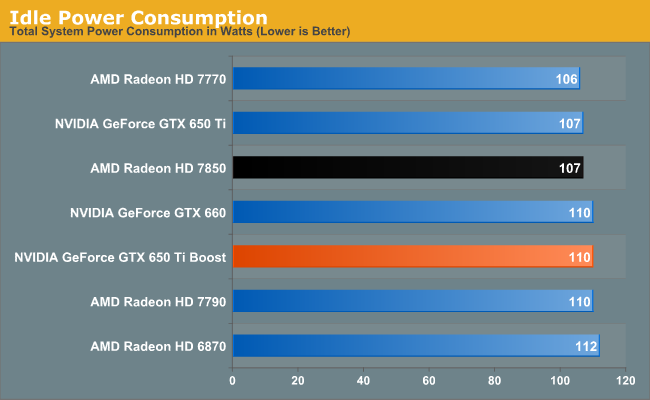
Starting as always with idle power, 110W at idle is par for the course for most NVIDIA cards. With the reactivation of the 3rd ROP partition the GTX 650 Ti Boost gives up the slight advantage the GTX 650 Ti gained here.
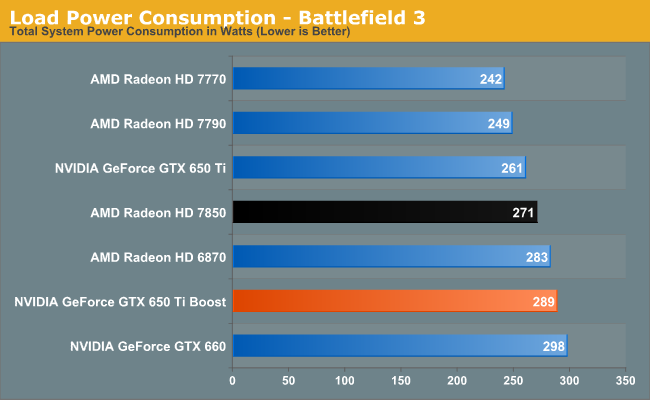
Moving on to our first and arguably most important load power test we have BF3. Power consumption in BF3 scales slightly with performance due to the extra work required of the CPU to feed more frames to a video card, but it usually paints some clear trends and this is no exception. NVIDIA may only be giving the GTX 650 Ti Boost a official TDP 6W lower than the GTX 660, but it’s clear power consumption is at least a little bit lower than that; we’re seeing 289W at the wall versus 298W for the GTX 660. On the other hand these results are 28W higher than the GTX 650 Ti, and even 18W higher than the 7850, never mind the 7790. The GTX 650 Ti Boost’s performance here is well ahead of everything other than the GTX 660, so this jump in power consumption does come with a performance boost, but it serves as a reminder that there is a tradeoff to be made. In the case of the GTX 650 Ti Boost, we’re seeing it pull away a bit from the efficiency curve set by NVIDIA’s other products.
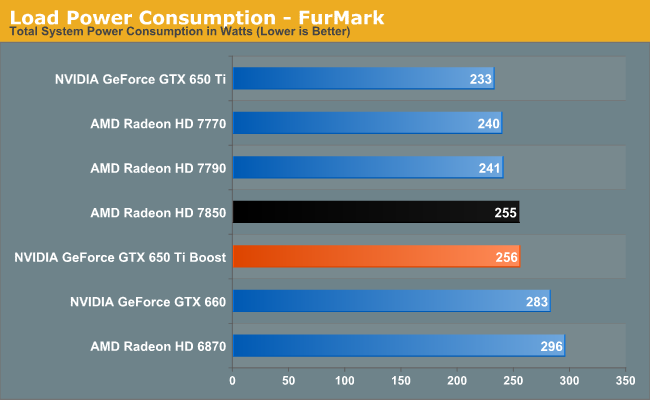
As for power consumption under FurMark, we’re seeing the more muted results for the GTX 650 Ti Boost. Here it’s roughly halfway between the GTX 650 Ti and GTX 660, and probably should be a bit higher still. The fact that there’s a difference (at the wall) of 27W between the GTX 660 and GTX 650 Ti Boost is more than we would except, and more than makes sense for cards that are identical except for a single fused off SMX. So we may also be seeing chip-to-chip variation play a part here. In any case, power consumption is also similar to the 7850, but this is one of those scenarios where we put more faith in the BF3 numbers than the FurMark numbers; NVIDIA appears to just outright be more aggressive on throttling here.
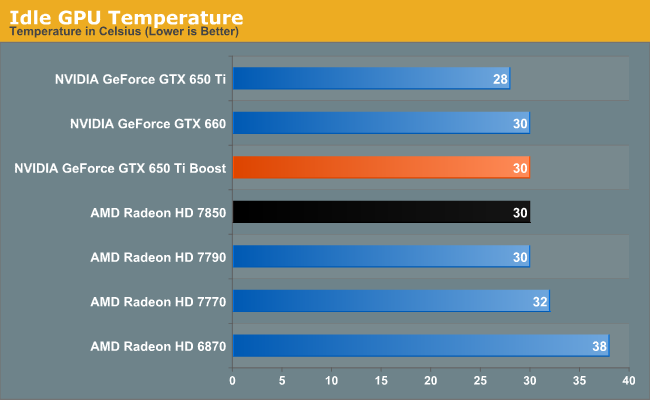
Utilizing the same cooler as the GTX 660, there’s no surprise here in seeing the GTX 650 Ti Boost hit the same 30C idle temperatures.
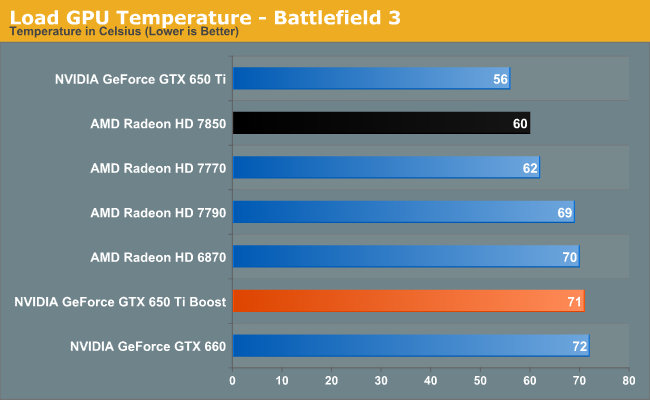
Similarly, our temperature results here closely parallel the GTX 660’s under load. The GTX 650 Ti Boost consumes a bit less power than the GTX 660, and doesn’t get quite as warm as a result. The large jump from the GTX 650 Ti comes as a bit of a shock to the eyes at first, but as the GTX 650 Ti Boost is a blower and one with a conservative fan curve at that, this is to be expected.
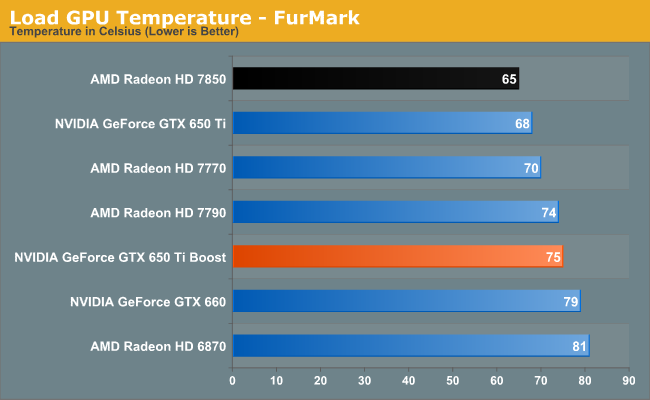
With FurMark we see temperatures go up, but for the most part things are consistent with what we saw under BF3. The larger gap between the GTX 650 Ti Boost and GTX 660 reflects the larger gap in power consumption we saw earlier.
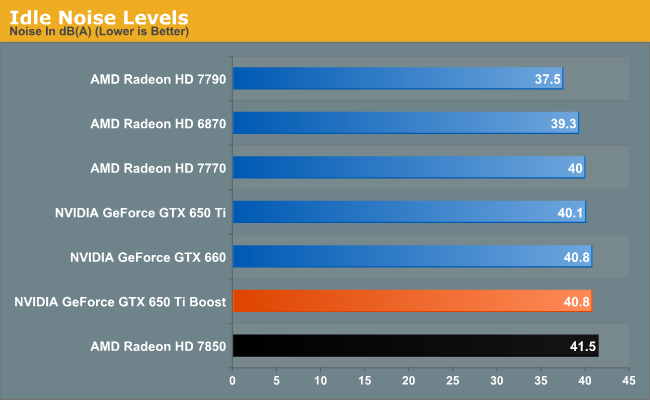
Just as with idle temperatures, the same GPU on the same cooler means we’re looking at the same idle noise temperatures. The blower NVIDIA uses here is quite good, but it can’t compete with simple open-air coolers like the 7790’s.
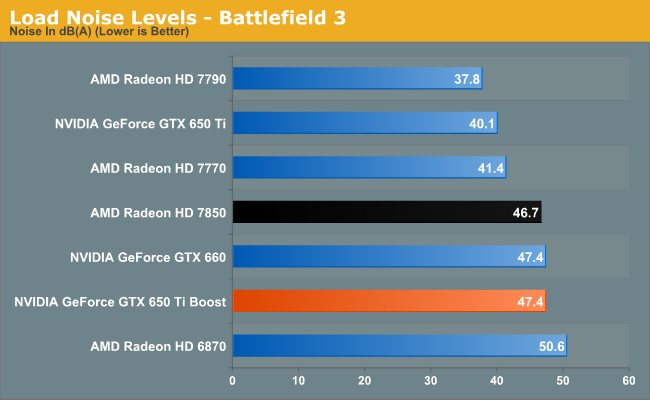
There’s a clear cutoff here between the open-air coolers and the blowers. The GTX 650 Ti Boost is quite a bit faster than something like the 7790 here, but the difference in noise is remarkable. Some of NVIDIA’s partner cards should fare much better here as they pack open-air coolers, with the usual tradeoff of giving up being fully-exhausting coolers. Still, this is a reminder that the GTX 650 Ti Boost pulls back from the efficiency curve a bit; it’s about 15% slower than the GTX 660 but no quieter for it.
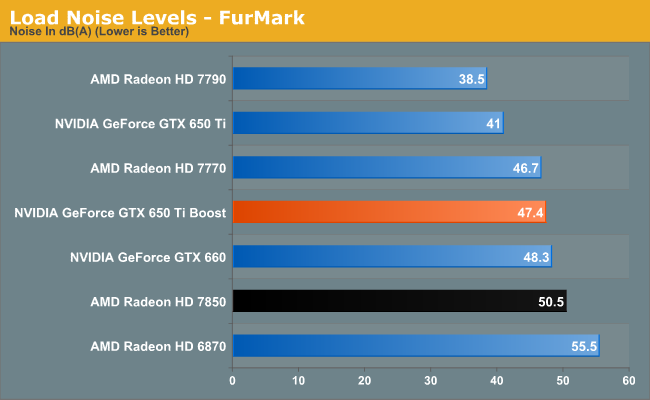
Finally we have load noise under FurMark. NVIDIA’s more aggressive throttling here means that our results don’t jump up to much from BF3. The GTX 650 Ti Boost does finally end up being a bit quieter than the GTX 660 due to the former’s lower power consumption, and this is the only time we see the GTX 650 Ti Boost gain an edge on the 7850 in power/temp/noise.


78 Comments
View All Comments
Oxford Guy - Tuesday, March 26, 2013 - link
Hopefully only to be laughed out of the market.xdesire - Tuesday, March 26, 2013 - link
Nvidia's last struggles with Kepler gen. :)Eugene86 - Tuesday, March 26, 2013 - link
So this card beats out the slightly cheaper new 7790 in every game as well as the slightly more expensive 7850 in half of the games?Looks like a pretty good deal to me. What reason do people have to buy AMD again?
Zstream - Tuesday, March 26, 2013 - link
I think the only game it won was in Shogun and bf3? I'm not sure on your statement or if you read the article or not.Eugene86 - Tuesday, March 26, 2013 - link
Did you read the article? Because the only games (one game) that the nvidia card lost in is Dirt.aTonyAtlaw - Tuesday, March 26, 2013 - link
I think you were looking at the GTX 660, friend. The 650 Ti Boost, the card under review, placed beneath the 7850 in nearly every test. They even talk about this on the conclusions page.Eugene86 - Tuesday, March 26, 2013 - link
I was talking about the 7790, that's why.Warren21 - Tuesday, March 26, 2013 - link
The comment you were replying to was challenging your statement of the 650 TiB beating the 7850 in "half". Two does not constitute half, it constitutes two.just4U - Wednesday, March 27, 2013 - link
Well Eugene, looking at your original statement you seem to be saying it beats the 7790 and the 7850.. (you added in the "as well as.." ) Anyway, no clue how the 2G 7790 does or how the 1G 650TIB does.. so it's all sorta moot. On paper if you ask me the 650 is the better card overall.EzioAs - Tuesday, March 26, 2013 - link
Bundled games? HD7850 uses less power and overclocks better? AMD cuts the price of their cards way more resulting in better performance per dollar cards before Nvidia actually release one that could fight back?It's true the GTX650ti Boost does seem pretty good for a newly released card in terms of performance per dollar but your question just shows a little bit "fanboyism".