Plextor M5M (256GB) mSATA Review
by Kristian Vättö on April 17, 2013 10:20 AM ESTRandom Read/Write Speed
The four corners of SSD performance are as follows: random read, random write, sequential read and sequential write speed. Random accesses are generally small in size, while sequential accesses tend to be larger and thus we have the four Iometer tests we use in all of our reviews.
Our first test writes 4KB in a completely random pattern over an 8GB space of the drive to simulate the sort of random access that you'd see on an OS drive (even this is more stressful than a normal desktop user would see). I perform three concurrent IOs and run the test for 3 minutes. The results reported are in average MB/s over the entire time. We use both standard pseudo randomly generated data for each write as well as fully random data to show you both the maximum and minimum performance offered by SandForce based drives in these tests. The average performance of SF drives will likely be somewhere in between the two values for each drive you see in the graphs. For an understanding of why this matters, read our original SandForce article.
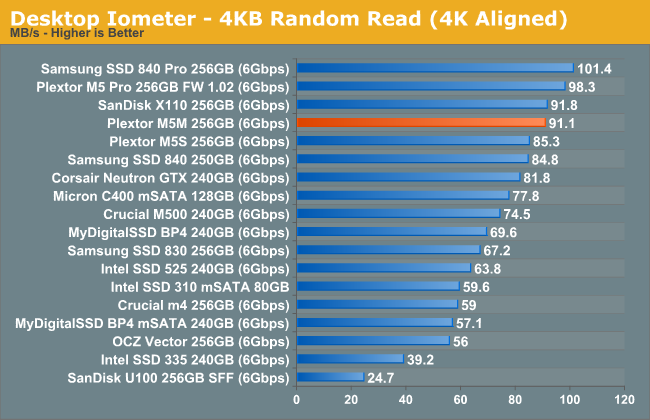
Random read performance is strong and nearly on par with the M5 Pro. However, at queue depth of 3 there is no substantial benefit from the increased parallelism with eight channels, hence the M5M is able to keep up.
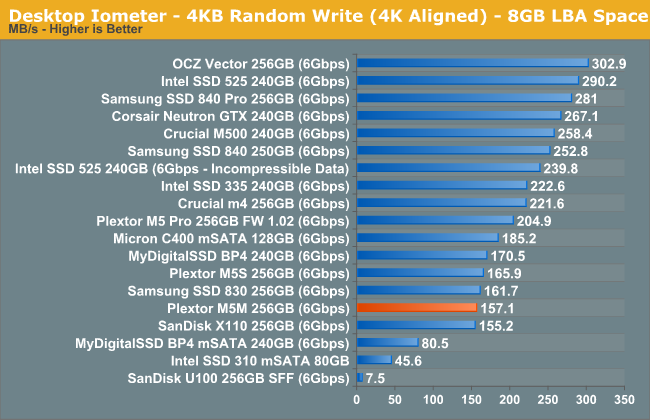
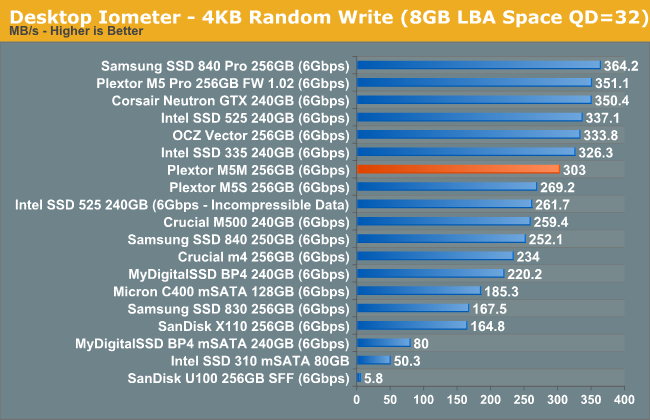
Random write speed at lower queue depths has never been Plextor's biggest advantage and the M5M is no exception. The performance is not terrible but it's behind compared to many of the other today's high-end SSDs. However, at higher queue depths the performance raises to a level similar to other SSDs:
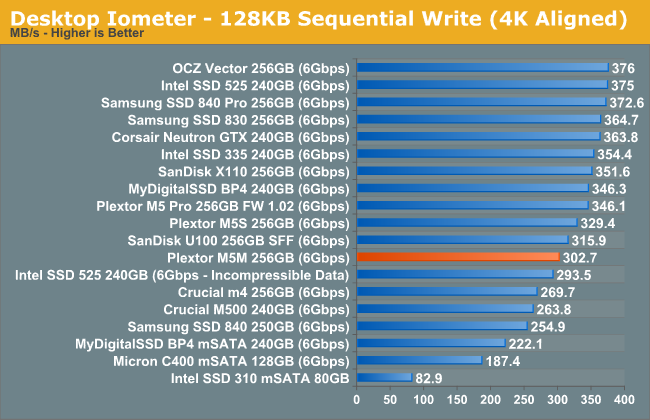
Sequential Read/Write Speed
To measure sequential performance I ran a 1 minute long 128KB sequential test over the entire span of the drive at a queue depth of 1. The results reported are in average MB/s over the entire test length.
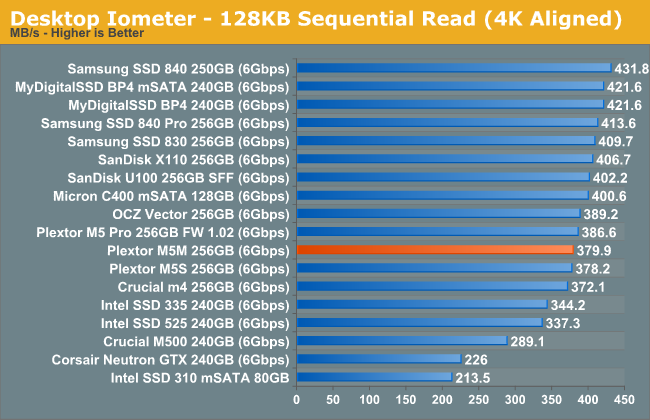
Sequential write speed is slightly lower than what you get with all eight channels populated, but the difference isn't dramatic.
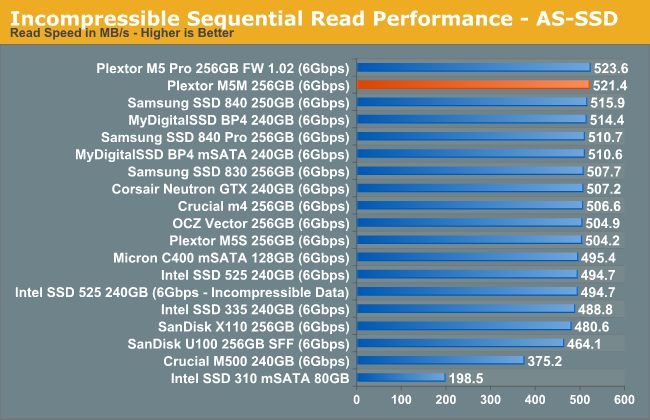
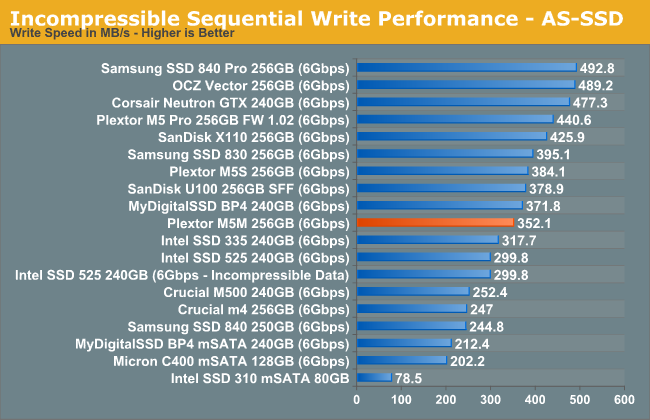
AS-SSD Incompressible Sequential Performance
The AS-SSD sequential benchmark uses incompressible data for all of its transfers. The result is a pretty big reduction in sequential write speed on SandForce based controllers.


36 Comments
View All Comments
JellyRoll - Thursday, April 18, 2013 - link
The consistency testing and all trace based testing used by this site are tested without partitions or filesystems, and no TRIM functionality. This has been disclosed by the staff in the comment sections of previous reviews.bobsmith1492 - Wednesday, April 17, 2013 - link
Hi Kristian,Let me know the regulator part number and I can calculate the loss in the regulator. The main difference is if it is a switching or linear part. A linear part will waste 100% * (5-3.3)/5 percent of the power, or 34% neglecting the usually small quiescent current. A switcher will waste less, usually 10-20%.
Kristian Vättö - Wednesday, April 17, 2013 - link
It's Micrel 29150 as far as I know. Here's the datasheet http://www.micrel.com/_PDF/mic29150.pdfAshaw - Wednesday, April 17, 2013 - link
That is a linear part. Current in = current out + the ground pin current. See the graph on page 10. The ground current is about 1/50 the output current in this part. so the input current is a good approximation of the output current.Ashaw - Wednesday, April 17, 2013 - link
So the powers in the graphs above should be approx 0.41W, 2.75W and 2.98 W respectively. (Maybe slightly less in le lower digit if I were to include regulator losses).bobsmith1492 - Wednesday, April 17, 2013 - link
Agreed, the SSD is using approximately 66% of the measured power on the 5V rail.JellyRoll - Wednesday, April 17, 2013 - link
There are two problems with this statement:"In our Intel SSD DC S3700 review Anand introduced a new method of characterizing performance: looking at the latency of individual operations over time."
1. Anand did not introduce this testing, another website did.
2. it isnt looking at individual operations, thousands of operations are happening per second, hence the term 'IOPS' (I/O Per Second)
JellyRoll - Wednesday, April 17, 2013 - link
Actually there is a third problem with the statement, it isnt looking at latency either. It is looking at IOPS, which is much different than latency. There are no latency numbers in this test.JPForums - Thursday, April 18, 2013 - link
There are no latency numbers displayed directly in the results, but latencies are implicit in the IOPS measurement. You may not be getting individual operation latencies, but IOPS is the inverse of average operation latency. So Just divide 1 by the number IOPS and you'll get your average operation latency.In general, I give reviewers the benefit of the doubt and try to put aside small slip ups in nomenclature or semantics as long as it is relatively easy to understand the points they are trying to make. That said, you seem to have it out for Kristian (or perhaps Anandtech as a whole), giving no slack and even reading things into statements that I'm not sure are there. I have no vested interest in Anandtech beyond the interest of reading good reviews, but I have to ask, did Kristian kick your dog or something? I'm honestly interested if you have a legitimate grievance.
JellyRoll - Thursday, April 18, 2013 - link
Pointing out numerous problems with methodology is simply that, in particular the consistency tests are wildly misleading for a number of reasons, the least of which is an unreal workload. I will not resort to replying to thinly veiled flamebait attempts.