Plextor M5M (256GB) mSATA Review
by Kristian Vättö on April 17, 2013 10:20 AM ESTPerformance Consistency
In our Intel SSD DC S3700 review Anand introduced a new method of characterizing performance: looking at the latency of individual operations over time. The S3700 promised a level of performance consistency that was unmatched in the industry, and as a result needed some additional testing to show that. The reason we don't have consistent IO latency with SSDs is because inevitably all controllers have to do some amount of defragmentation or garbage collection in order to continue operating at high speeds. When and how an SSD decides to run its defrag and cleanup routines directly impacts the user experience. Frequent (borderline aggressive) cleanup generally results in more stable performance, while delaying that can result in higher peak performance at the expense of much lower worst case performance. The graphs below tell us a lot about the architecture of these SSDs and how they handle internal defragmentation.
To generate the data below I took a freshly secure erased SSD and filled it with sequential data. This ensures that all user accessible LBAs have data associated with them. Next I kicked off a 4KB random write workload across all LBAs at a queue depth of 32 using incompressible data. I ran the test for just over half an hour, no where near what we run our steady state tests for but enough to give me a good look at drive behavior once all spare area filled up.
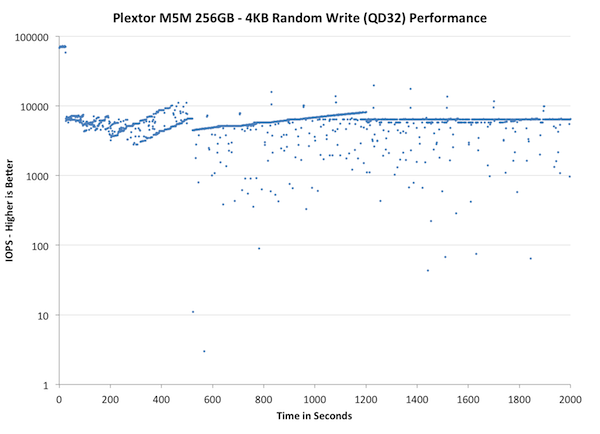
I recorded instantaneous IOPS every second for the duration of the test. I then plotted IOPS vs. time and generated the scatter plots below. Each set of graphs features the same scale. The first two sets use a log scale for easy comparison, while the last set of graphs uses a linear scale that tops out at 40K IOPS for better visualization of differences between drives.
The high level testing methodology remains unchanged from our S3700 review. Unlike in previous reviews however, I did vary the percentage of the drive that I filled/tested depending on the amount of spare area I was trying to simulate. The buttons are labeled with the advertised user capacity had the SSD vendor decided to use that specific amount of spare area. If you want to replicate this on your own all you need to do is create a partition smaller than the total capacity of the drive and leave the remaining space unused to simulate a larger amount of spare area. The partitioning step isn't absolutely necessary in every case but it's an easy way to make sure you never exceed your allocated spare area. It's a good idea to do this from the start (e.g. secure erase, partition, then install Windows), but if you are working backwards you can always create the spare area partition, format it to TRIM it, then delete the partition. Finally, this method of creating spare area works on the drives we've tested here but not all controllers may behave the same way.
The first set of graphs shows the performance data over the entire 2000 second test period. In these charts you'll notice an early period of very high performance followed by a sharp dropoff. What you're seeing in that case is the drive alllocating new blocks from its spare area, then eventually using up all free blocks and having to perform a read-modify-write for all subsequent writes (write amplification goes up, performance goes down).
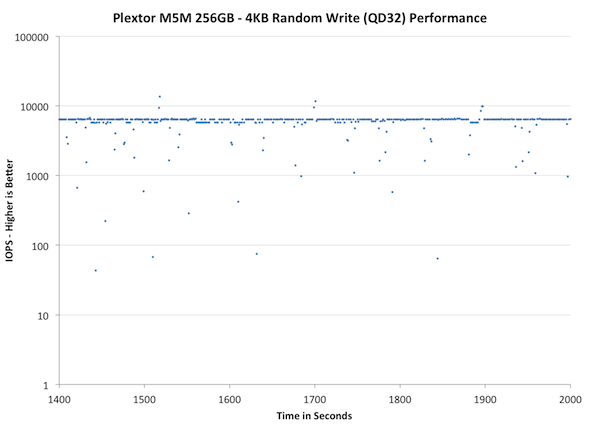
The second set of graphs zooms in to the beginning of steady state operation for the drive (t=1400s). The third set also looks at the beginning of steady state operation but on a linear performance scale. Click the buttons below each graph to switch source data.
| Impact of Spare Area | ||||||||
| Plextor M5M 256GB | Plextor M5 Pro 256GB | Intel SSD 525 240GB | Corsair Neutron 240GB | OCZ Vector 256GB | Samsung SSD 840 Pro 256GB | |||
| Default | ||||||||
| 25% Spare Area | - | |||||||
The M5M does a lot better than the M5 Pro but its consistency is still slightly behind OCZ Vector and Samsung SSD 840 Pro. I believe the reason why M5M's graph looks so different is Plextor's garbage collection method. Vector and SSD 840 are doing a lot more active garbage collection, which means they are constantly cleaning blocks and rearranging data. That's why their performance is constantly varying: At one second you're pushing data at 20K IOPS, the next at 5K IOPS and on the third you're back to 20K IOPS.
Plextor's approach is different, their garbage collection isn't triggered until it's an absolute must (or the drive is idling). In this case, after 500 seconds of 4KB random writes, there are no empty blocks left and the firmware must do garbage collection before it can process the next write request. The result? Performance drops to below 100 IOPS. This is the problem with the "clean up later" approach. As you'll soon see in the steady state graphs below, the drive completely stops (zero IOPS) every now and then. The drive is simply in such a dirty state that it must spend possibly seconds doing garbage collection before it can process the next IO. Sure, the IO may then transfer at 10K IOPS but you've already noticed the hiccup when the drive was doing GC.
This can actually be applied to real world very easily. Imagine that you're doing the dishes the old fashioned way (i.e. by hand). If you do the dishes after every meal, you'll have to do the dishes more often but you'll only spend a little time doing them at a time. If you do the dishes once a day, it will take you a longer time to get them all done. The total time spend doing dishes will most likely be around the same, but doing them all at once will stop you from doing other activities for a longer period of time. If a friend calls and asks you out, you can't go because you have a pile of dishes to do, or you may be able to go but it will take you a while. Had you done the dishes after every meal, you would have been free to go. In this analogy, doing the dishes is obviously garbage collection and going out is a write request from the host.
There's no clear ruling about which is better, active or idle garbage collection, but we have always preferred the active (though not too aggressive) method. The peak performance may be lower but consistency is a lot higher because you won't have sudden drops in the IOPS.
One quick note about the M5 Pro before we go forward. I asked Plextor about the IO consistency in the M5 Pro after our review of the new 1.02 firmware went live. A few weeks ago Plextor got back to me and told that the 1.02 firmware has a bug that causes the consistency to be as horrible as it is. However, this is only in the old M5 Pro (not in the new Xtreme with slightly different PCB and NAND) and they are working on a new firmware to fix the issue. I should have the new Xtreme here in the next few days so I can test and see if the issue only exists in the old M5 Pro. The M5M definitely doesn't suffer from this issue, although its IO consistency has room for improvement.
Lets move on to steady state performance, shall we?
| Impact of Spare Area | ||||||||
| Plextor M5M 256GB | Plextor M5 Pro 256GB | Intel SSD 525 240GB | Corsair Neutron 240GB | OCZ Vector 256GB | Samsung SSD 840 Pro 256GB | |||
| Default | ||||||||
| 25% Spare Area | - | |||||||
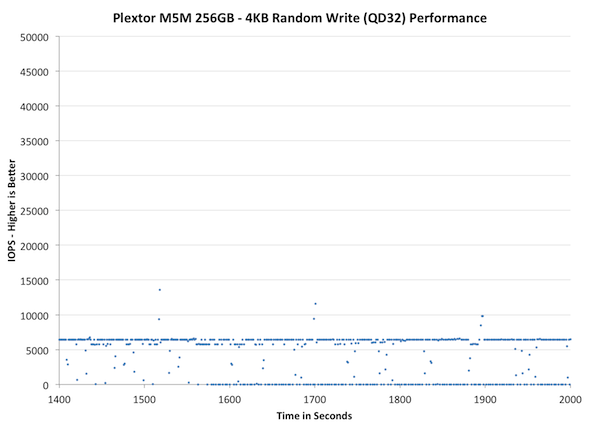
The impact of "clean up later" is even easier to see during steady state. Most of the other SSDs vary between 1K and 10K IOPS but the M5M dips below 100 IOPS every now and then. The majority of IOs are transferring at about 7K IOPS, which is pretty good, but the drops will still affect the performance. The non-logarithmic graph below will do an even better job at showing this:
| Impact of Spare Area | ||||||||
| Plextor M5M 256GB | Plextor M5 Pro 256GB | Intel SSD 525 240GB | Corsair Neutron 240GB | OCZ Vector 256GB | Samsung SSD 840 Pro 256GB | |||
| Default | ||||||||
| 25% Spare Area | - | |||||||
Now, what you're seeing are two main lines: One at ~7K IOPS and the other at 0 IOPS. This really shows how bad the situation can be if you don't clean up the mess from early on. About every third second the M5M completely stops to do garbage collection. It's unlikely for consumers to put the SSDs in a state similar to ours but we still shouldn't see SSDs completely stopping anymore. It was an issue a few years ago and back then it was somewhat acceptable given the immaturity of consumer SSDs; today it should not exist.
Fortunately, giving the M5M 25% over-provisioning helps a lot. It's still not as good as for example OCZ Vector or Corsair Neutron GTX, but the minimum IOPS is now over 20K (no more sudden 0 IOPS drops). You can still see the impact of the "clean up later" approach but the drop is only 5K IOPS, which shouldn't be very noticeable. I strongly recommend having at least 25% free space with the M5M. The more you fill the drive, the more likely it is that you'll face inconsistent performance.


36 Comments
View All Comments
kmmatney - Wednesday, April 17, 2013 - link
" I strongly recommend having at least 25% free space with the M5M. The more you fill the drive, the more likely it is that you'll face inconsistent performance."Would this really effect the average user? Do you let the drives idle long enough so the normal garbage collection can kick in?
msahni - Wednesday, April 17, 2013 - link
Hi there,First of all Kristian thanks for the reviews. You've finally answered my queries about the best mSATA SSD to get. (from the Intel 525 review)
Could you please advise what is the best method to leave the 25% free space on the drive for over provisioning to enhance the performance.
Cheers....
Minion4Hire - Wednesday, April 17, 2013 - link
Anand answered that in another article. I believe you are supposed to shrink the partition, create a second partition out of the unallocated space, then delete the new partition. The act of deleting the partition brings the OS to TRIM that portion of the drive freeing it up for use as spare area. And since you won't be writing to it any more it is permanently spare area (well, unless you repartition or something)xdrol - Wednesday, April 17, 2013 - link
Actually, Windows does not trim when you delete a partition, rather when you create a new one.Hrel - Wednesday, April 17, 2013 - link
I have wondered for a long time if the extra free space is really necessary. Home users aren't benchmarking, drives are mostly idle. Not often do you transfer 100GB at a time or install programs.JellyRoll - Wednesday, April 17, 2013 - link
Unrealistic workloads for a consumer environment result in unrealistic test results. How many consumer notebooks or laptops, hell even enterprise mobile devices, will be subjected to this type of load? Answer: Zero.Even in a consumer desktop this is NEVER going to happen.
JPForums - Thursday, April 18, 2013 - link
It was stated a long time ago at Anandtech that their testing was harsher than typical consumer loads for the express purpose of separating the field. Under typical consumer workloads, there is practically no difference between modern drives. I don't know how many times I've read that any SSD is a significant step up from an HDD. It has pretty much been a standing assumption since the old jMicron controllers left the market. However, more information is required for those that need (or think they need) the performance to handle heavier workloads.Personally, everything else being equal, I'd rather have the drive that performs better/more consistently, even if it is only in workloads I never see. I don't think Kristian is trying to pull the wool over your eyes. He simply gives the readers here enough credit to make up their own mind about the level of performance they need.
Kristian Vättö - Wednesday, April 17, 2013 - link
If the drive is nearly full and there's no extra OP, then it's possible that even normal (but slightly larger/heavier, like app installation) usage will cause the performance to become inconsistent which will affect the overall performance (average IOPS will go down). Performance will of course recover with idle time but the hit in performance has already been experienced.JellyRoll - Wednesday, April 17, 2013 - link
Running a simple trace of an application install will show that this is not an accurate statement. This testing also does not benefit from TRIM because there is no filesystem during the test. This ends up making an overly-negative portrayal.JPForums - Thursday, April 18, 2013 - link
Which test in particular are you referring to that has no access to TRIM, that otherwise would?As far as application traces go, I can confirm Kristian's statement is accurate on both a Corsair Force GT 120GB and a Crucial M4 128GB. Performance drops appreciably when installing programs with a large number of small files (or copying a large number of small files I.E. Libraries). As an aside, it can also tank the performance of Xilinx ISE, which is typically limited by memory bandwidth and single threaded CPU performance.