Intel SSD 525 Review (240GB)
by Anand Lal Shimpi on January 30, 2013 1:42 AM ESTPerformance Consistency
In our Intel SSD DC S3700 review I introduced a new method of characterizing performance: looking at the latency of individual operations over time. The S3700 promised a level of performance consistency that was unmatched in the industry, and as a result needed some additional testing to show that. The reason we don't have consistent IO latency with SSDs is because inevitably all controllers have to do some amount of defragmentation or garbage collection in order to continue operating at high speeds. When and how an SSD decides to run its defrag and cleanup routines directly impacts the user experience. Frequent (borderline aggressive) cleanup generally results in more stable performance, while delaying that can result in higher peak performance at the expense of much lower worst case performance. The graphs below tell us a lot about the architecture of these SSDs and how they handle internal defragmentation.
To generate the data below I took a freshly secure erased SSD and filled it with sequential data. This ensures that all user accessible LBAs have data associated with them. Next I kicked off a 4KB random write workload across all LBAs at a queue depth of 32 using incompressible data. I ran the test for just over half an hour, no where near what we run our steady state tests for but enough to give me a good look at drive behavior once all spare area filled up.
I recorded instantaneous IOPS every second for the duration of the test. I then plotted IOPS vs. time and generated the scatter plots below. Each set of graphs features the same scale. The first two sets use a log scale for easy comparison, while the last set of graphs uses a linear scale that tops out at 40K IOPS for better visualization of differences between drives.
The high level testing methodology remains unchanged from our S3700 review. Unlike in previous reviews however, I did vary the percentage of the drive that I filled/tested depending on the amount of spare area I was trying to simulate. The buttons are labeled with the advertised user capacity had the SSD vendor decided to use that specific amount of spare area. If you want to replicate this on your own all you need to do is create a partition smaller than the total capacity of the drive and leave the remaining space unused to simulate a larger amount of spare area. The partitioning step isn't absolutely necessary in every case but it's an easy way to make sure you never exceed your allocated spare area. It's a good idea to do this from the start (e.g. secure erase, partition, then install Windows), but if you are working backwards you can always create the spare area partition, format it to TRIM it, then delete the partition. Finally, this method of creating spare area works on the drives I've tested here but not all controllers may behave the same way.
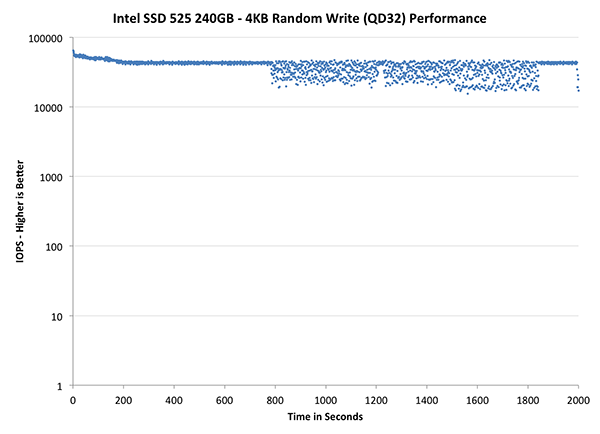
The first set of graphs shows the performance data over the entire 2000 second test period. In these charts you'll notice an early period of very high performance followed by a sharp dropoff. What you're seeing in that case is the drive alllocating new blocks from its spare area, then eventually using up all free blocks and having to perform a read-modify-write for all subsequent writes (write amplification goes up, performance goes down).
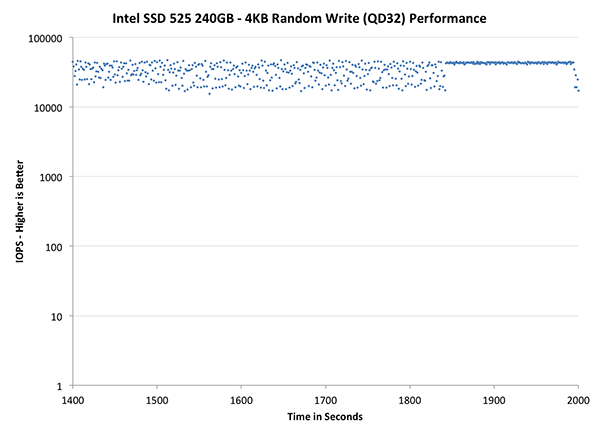
The second set of graphs zooms in to the beginning of steady state operation for the drive (t=1400s). The third set also looks at the beginning of steady state operation but on a linear performance scale. Click the buttons below each graph to switch source data.
| Impact of Spare Area | ||||||||
| Intel SSD DC S3700 200GB | Intel SSD 335 240GB | Intel SSD 525 240GB | Corsair Neutron 240GB | OCZ Vector 256GB | Samsung SSD 840 Pro 256GB | |||
| Default | ||||||||
| 25% Spare Area | - | - | - | |||||
I'm not entirely sure what's going on in this curve as normally what we see is continued dropoff after around 1800 seconds of hammering the drive. There's a chance that Intel has pushed for more IO consistency in the 525's firmware, or it's more likely that something funny happened during our testing process. I'll be repeating this test immediately after I get back from the RIM event and will update the results accordingly. What we see up to the 1800 second mark is consistent with other SandForce based SSDs. There's great IO consistency for a while but then a clear degradation if you're hitting the drive with incompressible data.
Where SandForce gets a reprieve is in the fact that the drive is almost never in this state, even if it's full. A big part of your OS and applications will always be compressible, which gives the controller more free space to work with. As a result, the IO distribution ends up looking a lot tighter than what we're showing here.
The next set of charts look at the steady state (for most drives) portion of the curve. Here we'll get some better visibility into how everyone will perform over the long run.
| Impact of Spare Area | ||||||||
| Intel SSD DC S3700 200GB | Intel SSD 335 240GB | Intel SSD 525 240GB | Corsair Neutron 240GB | OCZ Vector 256GB | Samsung SSD 840 Pro 256GB | |||
| Default | ||||||||
| 25% Spare Area | - | - | - | |||||
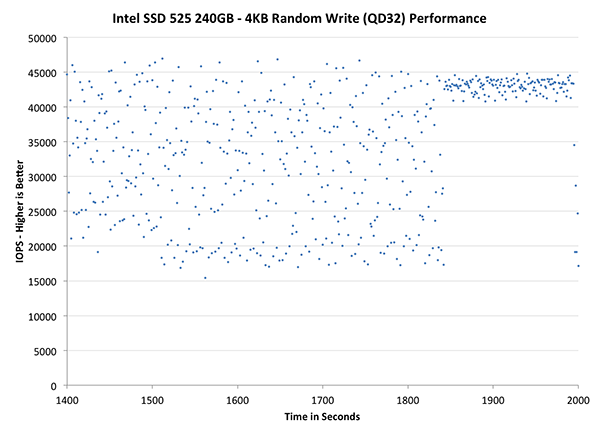
The final set of graphs abandons the log scale entirely and just looks at a linear scale that tops out at 50K IOPS. We're also only looking at steady state (or close to it) performance here:
| Impact of Spare Area | ||||||||
| Intel SSD DC S3700 200GB | Intel SSD 335 240GB | Intel SSD 525 240GB | Corsair Neutron 240GB | OCZ Vector 256GB | Samsung SSD 840 Pro 256GB | |||
| Default | ||||||||
| 25% Spare Area | - | - | - | |||||
In the truly worst case scenario, the 525 is hardly consistent although minimum performance isn't anywhere near as bad as many of the other controllers. Hang tight as I'll be updating this page with results including larger effective spare area (which will be a better approximation of real world consistency given SF's real time compression/de-dupe keeps NAND less populated by default) and some more investigation as to what's going on with IO consistency towards the end of the curve here.


21 Comments
View All Comments
damnintel - Wednesday, March 13, 2013 - link
heyyyy check this out damnintel dot com