Intel SSD 525 Review (240GB)
by Anand Lal Shimpi on January 30, 2013 1:42 AM ESTAnandTech Storage Bench 2011
Two years ago we introduced our AnandTech Storage Bench, a suite of benchmarks that took traces of real OS/application usage and played them back in a repeatable manner. I assembled the traces myself out of frustration with the majority of what we have today in terms of SSD benchmarks.
Although the AnandTech Storage Bench tests did a good job of characterizing SSD performance, they weren't stressful enough. All of the tests performed less than 10GB of reads/writes and typically involved only 4GB of writes specifically. That's not even enough exceed the spare area on most SSDs. Most canned SSD benchmarks don't even come close to writing a single gigabyte of data, but that doesn't mean that simply writing 4GB is acceptable.
Originally I kept the benchmarks short enough that they wouldn't be a burden to run (~30 minutes) but long enough that they were representative of what a power user might do with their system.
Not too long ago I tweeted that I had created what I referred to as the Mother of All SSD Benchmarks (MOASB). Rather than only writing 4GB of data to the drive, this benchmark writes 106.32GB. It's the load you'd put on a drive after nearly two weeks of constant usage. And it takes a *long* time to run.
1) The MOASB, officially called AnandTech Storage Bench 2011 - Heavy Workload, mainly focuses on the times when your I/O activity is the highest. There is a lot of downloading and application installing that happens during the course of this test. My thinking was that it's during application installs, file copies, downloading and multitasking with all of this that you can really notice performance differences between drives.
2) I tried to cover as many bases as possible with the software I incorporated into this test. There's a lot of photo editing in Photoshop, HTML editing in Dreamweaver, web browsing, game playing/level loading (Starcraft II & WoW are both a part of the test) as well as general use stuff (application installing, virus scanning). I included a large amount of email downloading, document creation and editing as well. To top it all off I even use Visual Studio 2008 to build Chromium during the test.
The test has 2,168,893 read operations and 1,783,447 write operations. The IO breakdown is as follows:
| AnandTech Storage Bench 2011 - Heavy Workload IO Breakdown | ||||
| IO Size | % of Total | |||
| 4KB | 28% | |||
| 16KB | 10% | |||
| 32KB | 10% | |||
| 64KB | 4% | |||
Only 42% of all operations are sequential, the rest range from pseudo to fully random (with most falling in the pseudo-random category). Average queue depth is 4.625 IOs, with 59% of operations taking place in an IO queue of 1.
Many of you have asked for a better way to really characterize performance. Simply looking at IOPS doesn't really say much. As a result I'm going to be presenting Storage Bench 2011 data in a slightly different way. We'll have performance represented as Average MB/s, with higher numbers being better. At the same time I'll be reporting how long the SSD was busy while running this test. These disk busy graphs will show you exactly how much time was shaved off by using a faster drive vs. a slower one during the course of this test. Finally, I will also break out performance into reads, writes and combined. The reason I do this is to help balance out the fact that this test is unusually write intensive, which can often hide the benefits of a drive with good read performance.
There's also a new light workload for 2011. This is a far more reasonable, typical every day use case benchmark. Lots of web browsing, photo editing (but with a greater focus on photo consumption), video playback as well as some application installs and gaming. This test isn't nearly as write intensive as the MOASB but it's still multiple times more write intensive than what we were running in 2010.
As always I don't believe that these two benchmarks alone are enough to characterize the performance of a drive, but hopefully along with the rest of our tests they will help provide a better idea.
The testbed for Storage Bench 2011 has changed as well. We're now using a Sandy Bridge platform with full 6Gbps support for these tests.
AnandTech Storage Bench 2011 - Heavy Workload
We'll start out by looking at average data rate throughout our new heavy workload test:
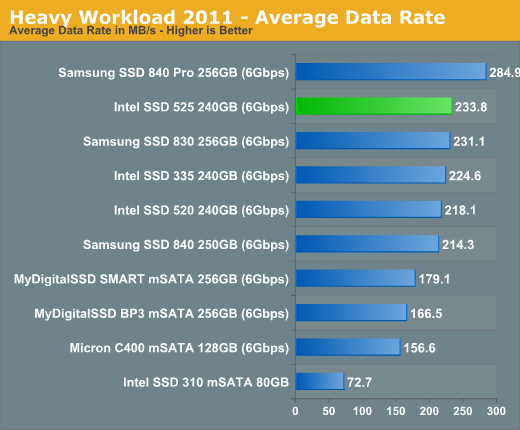
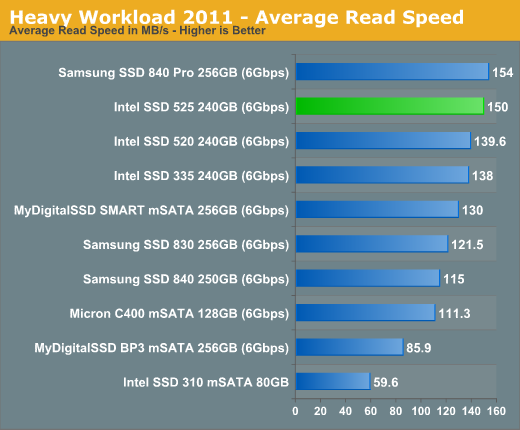
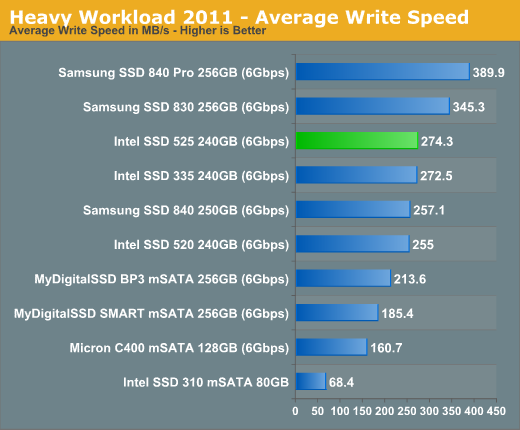
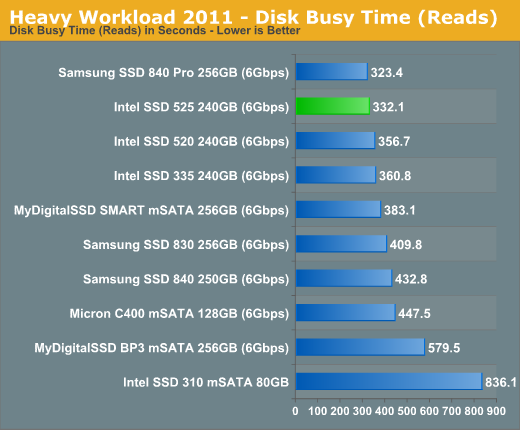
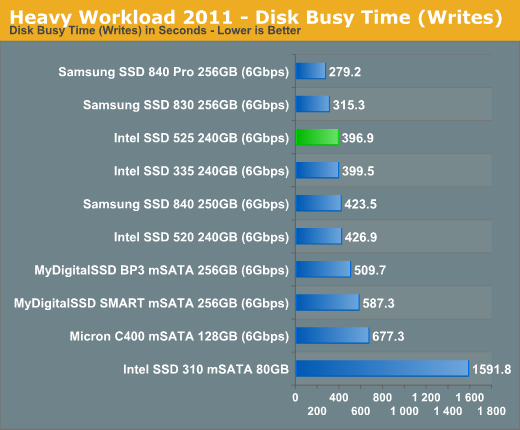
The 525 does manage to pull a small but tangible advantage over the 520 in our heavy workload test. The performance advantage seems to be largely due to improvement in write speed if we look at the breakdown:
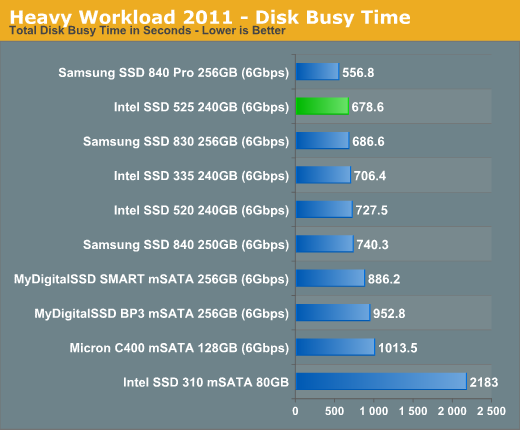
The next three charts just represent the same data, but in a different manner. Instead of looking at average data rate, we're looking at how long the disk was busy for during this entire test. Note that disk busy time excludes any and all idles, this is just how long the SSD was busy doing something:


21 Comments
View All Comments
vcorem - Wednesday, January 30, 2013 - link
http://m.tomshardware.com/news/Mushkin-480GB-mSATA...IanCutress - Wednesday, January 30, 2013 - link
Mushkin uses a stacked daughter board to achieve 480GB. This is usually ok in a motherboard, but not in a z-height limited mobile device. While it's still electrically mSATA, it is technically outside the mSATA specifications which limit z-height (if I recall correctly).lukarak - Wednesday, January 30, 2013 - link
What is the chip density in the 768 GB SSD board in a rMBP? Does it have 12?Kristian Vättö - Wednesday, January 30, 2013 - link
Yup, the 768GB SSD in rMBP has twelve 64GB (8x8GB) packages.However, SandForce has much stricter restrictions, the SF-2281/2 can only access up to 64 NAND dies (that's up to 512GB with 8GB dies). Samsung could build a 1TB drive if they wanted to, they just don't see the market for it (yet).
lukarak - Wednesday, January 30, 2013 - link
Thanks for the answer.On a slightly related note, the iPad (late 2012) 16 GB, has a single NAND chip, as could be seen in the teardowns, and there doesn't seem to be any room for more. Do you perhaps know, or care to speculate, how the higher capacity ones are configured, especially the new 128 GB version?
Kristian Vättö - Wednesday, January 30, 2013 - link
The 128GB model is most likely using new 128Gb (16GB) NAND dies to enable the higher capacity. You can only stack up to eight dies in a single package, so a higher capacity die was needed before you could go over 64GB (8x 16GB is 128GB).At least Samsung and IMFT have 128Gb dies in production but they most likely weren't available in volume when the iPad 4 was initially launched, hence the delay.
lukarak - Wednesday, January 30, 2013 - link
Makes sense, thanks for the insight.SAMSAMHA - Wednesday, January 30, 2013 - link
hi, AnandI am curious what board are you using to test this since none of the desktop board with mSATA that I know has SATA 6Gbps interface.
SodaAnt - Wednesday, January 30, 2013 - link
There are msata to sata conversion boards that work fine because msata and sata are electrically the same.Meaker10 - Wednesday, January 30, 2013 - link
The msi gt60 can ship with a pair of msata gen3 slots configurable in raid.