Transcend SSD320 & SSD720 (256GB) Review
by Kristian Vättö on January 25, 2013 11:31 AM ESTAnandTech Storage Bench 2011
Last year we introduced our AnandTech Storage Bench, a suite of benchmarks that took traces of real OS/application usage and played them back in a repeatable manner. Anand assembled the traces out of frustration with the majority of what we have today in terms of SSD benchmarks.
Although the AnandTech Storage Bench tests did a good job of characterizing SSD performance, they weren't stressful enough. All of the tests performed less than 10GB of reads/writes and typically involved only 4GB of writes specifically. That's not even enough exceed the spare area on most SSDs. Most canned SSD benchmarks don't even come close to writing a single gigabyte of data, but that doesn't mean that simply writing 4GB is acceptable.
Originally we kept the benchmarks short enough that they wouldn't be a burden to run (~30 minutes) but long enough that they were representative of what a power user might do with their system. Later, however, we created what we refer to as the Mother of All SSD Benchmarks (MOASB). Rather than only writing 4GB of data to the drive, this benchmark writes 106.32GB. This represents the load you'd put on a drive after nearly two weeks of constant usage. And it takes a long time to run.
1) The MOASB, officially called AnandTech Storage Bench 2011—Heavy Workload, mainly focuses on the times when your I/O activity is the highest. There is a lot of downloading and application installing that happens during the course of this test. Our thinking was that it's during application installs, file copies, downloading, and multitasking with all of this that you can really notice performance differences between drives.
2) We tried to cover as many bases as possible with the software incorporated into this test. There's a lot of photo editing in Photoshop, HTML editing in Dreamweaver, web browsing, game playing/level loading (Starcraft II and WoW are both a part of the test), as well as general use stuff (application installing, virus scanning). We included a large amount of email downloading, document creation, and editing as well. To top it all off we even use Visual Studio 2008 to build Chromium during the test.
The test has 2,168,893 read operations and 1,783,447 write operations. The IO breakdown is as follows:
| AnandTech Storage Bench 2011—Heavy Workload IO Breakdown | ||||
| IO Size | % of Total | |||
| 4KB | 28% | |||
| 16KB | 10% | |||
| 32KB | 10% | |||
| 64KB | 4% | |||
Only 42% of all operations are sequential; the rest ranges from pseudo to fully random (with most falling in the pseudo-random category). Average queue depth is 4.625 IOs, with 59% of operations taking place in an IO queue of 1.
Many of you have asked for a better way to really characterize performance. Simply looking at IOPS doesn't really say much. As a result we're going to be presenting Storage Bench 2011 data in a slightly different way. We'll have performance represented as Average MB/s, with higher numbers being better. At the same time we'll be reporting how long the SSD was busy while running this test. These disk busy graphs will show you exactly how much time was shaved off by using a faster drive vs. a slower one during the course of this test. Finally, we will also break out performance into reads, writes, and combined. The reason we do this is to help balance out the fact that this test is unusually write intensive, which can often hide the benefits of a drive with good read performance.
There's also a new light workload for 2011. This is a far more reasonable, typical every day use case benchmark. It has lots of web browsing, photo editing (but with a greater focus on photo consumption), video playback, as well as some application installs and gaming. This test isn't nearly as write intensive as the MOASB but it's still multiple times more write intensive than what we were running last year.
We don't believe that these two benchmarks alone are enough to characterize the performance of a drive, but hopefully along with the rest of our tests they will help provide a better idea. The testbed for Storage Bench 2011 has changed as well. We're now using a Sandy Bridge platform with full 6Gbps support for these tests.
AnandTech Storage Bench 2011—Heavy Workload
We'll start out by looking at average data rate throughout our new heavy workload test:
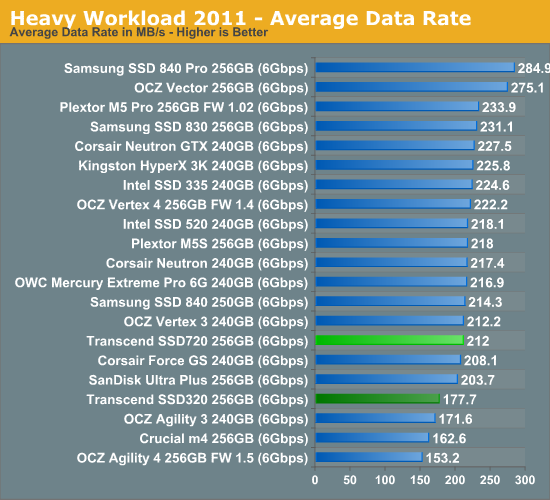
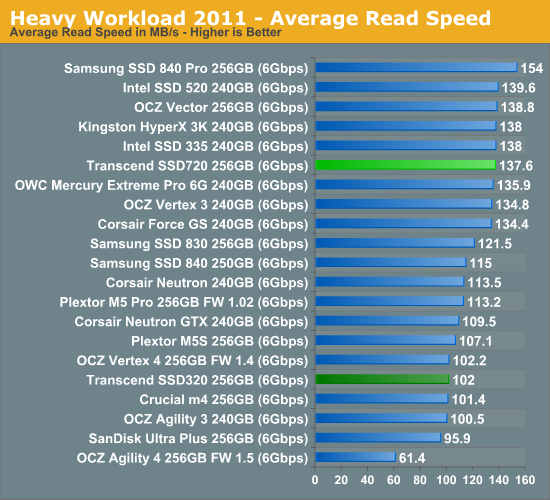
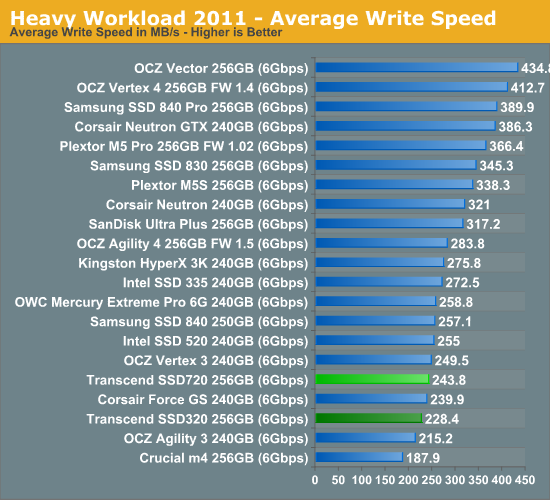
Our Heavy suite pretty much summarizes the results we saw in synthetic tests. The SSD720 is around 20% faster but most of the difference comes from its faster read speed, which is largely due to SSD320's poor read performance with incompressible data.
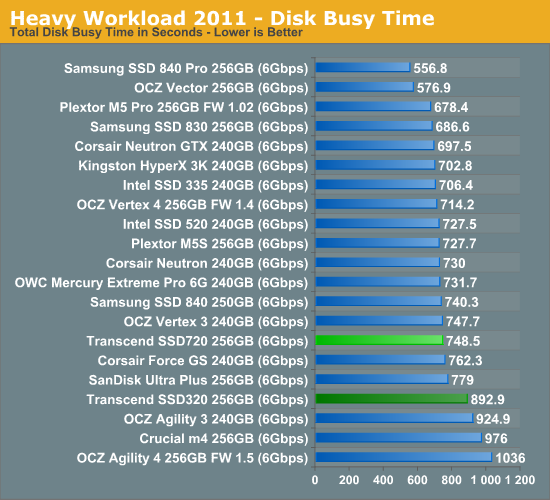
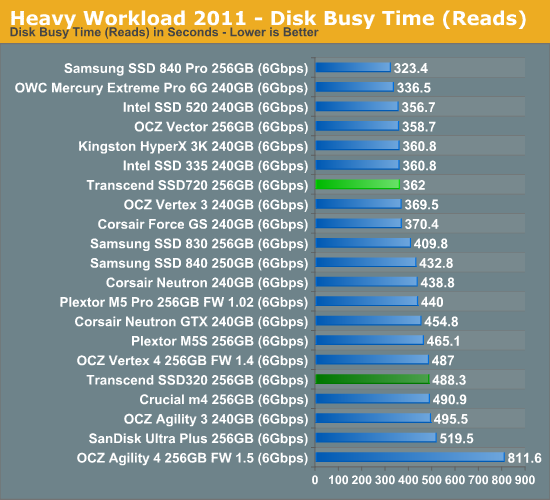
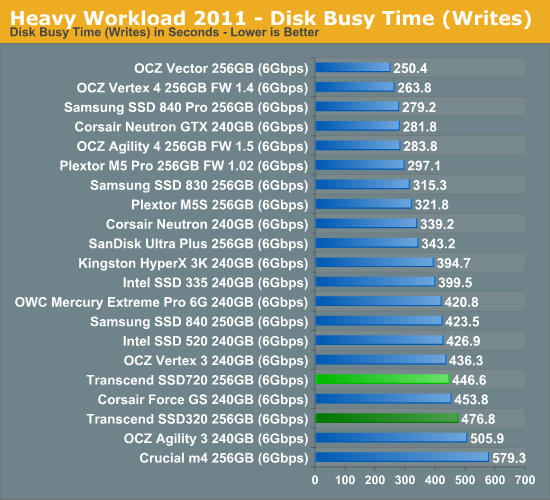
The next three charts just represent the same data, but in a different manner. Instead of looking at average data rate, we're looking at how long the disk was busy for during this entire test. Note that disk busy time excludes any and all idles, this is just how long the SSD was busy doing something:


34 Comments
View All Comments
Slash3 - Saturday, January 26, 2013 - link
I picked up one of these (128GB SSD320) when they were about half of the stated market price ($75) during a holiday sale, to put in my Lenovo X230 subcompact laptop. Works great in that capacity, is leaps and bounds above the performance of the stock HDD and adds a margin of shockproofing to a laptop that sees a lot of travel time. At higher prices, it's not as clear cut. If they manage to keep the prices competitive, it's not a bad alternative for a system that needs a basic SSD.Kristian Vättö - Saturday, January 26, 2013 - link
Yup, the regular SSD 840, not the Pro.dj christian - Friday, February 1, 2013 - link
Why not the Pro version?Scour - Saturday, February 16, 2013 - link
Because the Pro is much more expensive?killerbunnies - Saturday, January 26, 2013 - link
Where is the consistency performance for the last two SSD articles?And when can we expect the Intel 520 series 240GB SSD to be included in those graphs?
Kristian Vättö - Saturday, January 26, 2013 - link
There is no point in testing performance consistency with every model. We've tested performance consistency with Intel SSD 335 before, which tells us how SandForce based drives perform. There are no dramatic differences between SandForce based drives, hence we only test consistency when dealing with more unique SSDs.http://www.anandtech.com/show/6428/corsair-neutron...
Nickel020 - Saturday, January 26, 2013 - link
I would have thought that the lower spare area would have an impact on performance consistency. Do you not think that will be the case or is the capacity set apart for RAISE not usable as spare area?Kristian Vättö - Sunday, January 27, 2013 - link
Here are a few graphs of Intel SSD 335 with 25% OP:https://dl.dropbox.com/u/7934241/25%25%20OP_1.png
https://dl.dropbox.com/u/7934241/25%25%20OP_1.png
https://dl.dropbox.com/u/7934241/25%25%20OP%20non-...
Nickel020 - Sunday, January 27, 2013 - link
Thnaks, but I don't quite get it. 25% OP is more than usual, so performance should be more consistent at best, or the same at the worst. The Transcends have less OP though, and I was wondering how you think that would affect consistency?Kristian Vättö - Sunday, January 27, 2013 - link
Oh, sorry, misunderstood your post (I thought you were asking for how more OP would affect the IO consistency on a SandForce drive).Anyway, Transcend only has RAISE disabled - the actual space for OP is the same ~7%. RAISE should not impact consistency because it's just parity data (i.e. the blocks are not empty). However, I haven't tested this so I can't say for sure. Will definitely test, though, didn't even think about it from this angle.