Transcend SSD320 & SSD720 (256GB) Review
by Kristian Vättö on January 25, 2013 11:31 AM ESTAnandTech Storage Bench 2011
Last year we introduced our AnandTech Storage Bench, a suite of benchmarks that took traces of real OS/application usage and played them back in a repeatable manner. Anand assembled the traces out of frustration with the majority of what we have today in terms of SSD benchmarks.
Although the AnandTech Storage Bench tests did a good job of characterizing SSD performance, they weren't stressful enough. All of the tests performed less than 10GB of reads/writes and typically involved only 4GB of writes specifically. That's not even enough exceed the spare area on most SSDs. Most canned SSD benchmarks don't even come close to writing a single gigabyte of data, but that doesn't mean that simply writing 4GB is acceptable.
Originally we kept the benchmarks short enough that they wouldn't be a burden to run (~30 minutes) but long enough that they were representative of what a power user might do with their system. Later, however, we created what we refer to as the Mother of All SSD Benchmarks (MOASB). Rather than only writing 4GB of data to the drive, this benchmark writes 106.32GB. This represents the load you'd put on a drive after nearly two weeks of constant usage. And it takes a long time to run.
1) The MOASB, officially called AnandTech Storage Bench 2011—Heavy Workload, mainly focuses on the times when your I/O activity is the highest. There is a lot of downloading and application installing that happens during the course of this test. Our thinking was that it's during application installs, file copies, downloading, and multitasking with all of this that you can really notice performance differences between drives.
2) We tried to cover as many bases as possible with the software incorporated into this test. There's a lot of photo editing in Photoshop, HTML editing in Dreamweaver, web browsing, game playing/level loading (Starcraft II and WoW are both a part of the test), as well as general use stuff (application installing, virus scanning). We included a large amount of email downloading, document creation, and editing as well. To top it all off we even use Visual Studio 2008 to build Chromium during the test.
The test has 2,168,893 read operations and 1,783,447 write operations. The IO breakdown is as follows:
| AnandTech Storage Bench 2011—Heavy Workload IO Breakdown | ||||
| IO Size | % of Total | |||
| 4KB | 28% | |||
| 16KB | 10% | |||
| 32KB | 10% | |||
| 64KB | 4% | |||
Only 42% of all operations are sequential; the rest ranges from pseudo to fully random (with most falling in the pseudo-random category). Average queue depth is 4.625 IOs, with 59% of operations taking place in an IO queue of 1.
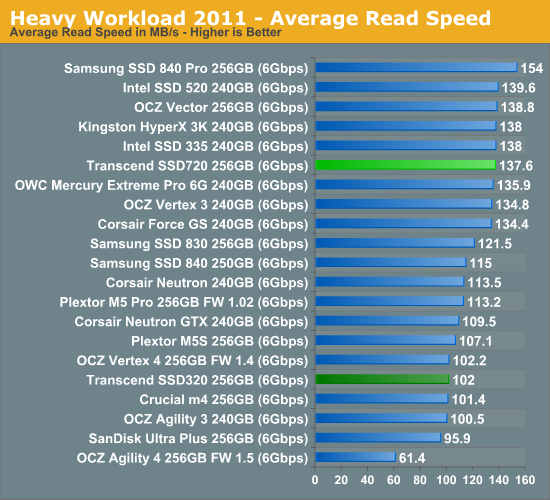
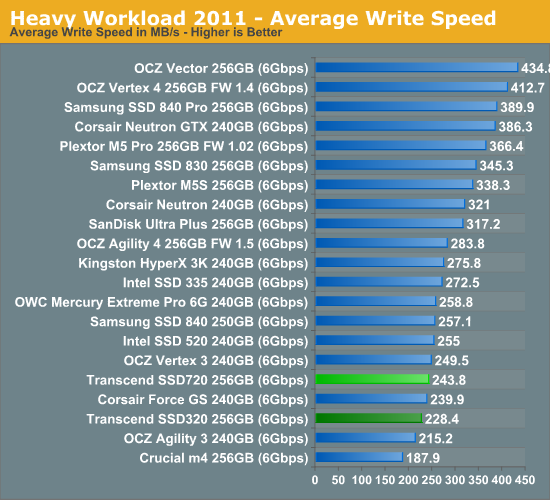
Many of you have asked for a better way to really characterize performance. Simply looking at IOPS doesn't really say much. As a result we're going to be presenting Storage Bench 2011 data in a slightly different way. We'll have performance represented as Average MB/s, with higher numbers being better. At the same time we'll be reporting how long the SSD was busy while running this test. These disk busy graphs will show you exactly how much time was shaved off by using a faster drive vs. a slower one during the course of this test. Finally, we will also break out performance into reads, writes, and combined. The reason we do this is to help balance out the fact that this test is unusually write intensive, which can often hide the benefits of a drive with good read performance.
There's also a new light workload for 2011. This is a far more reasonable, typical every day use case benchmark. It has lots of web browsing, photo editing (but with a greater focus on photo consumption), video playback, as well as some application installs and gaming. This test isn't nearly as write intensive as the MOASB but it's still multiple times more write intensive than what we were running last year.
We don't believe that these two benchmarks alone are enough to characterize the performance of a drive, but hopefully along with the rest of our tests they will help provide a better idea. The testbed for Storage Bench 2011 has changed as well. We're now using a Sandy Bridge platform with full 6Gbps support for these tests.
AnandTech Storage Bench 2011—Heavy Workload
We'll start out by looking at average data rate throughout our new heavy workload test:
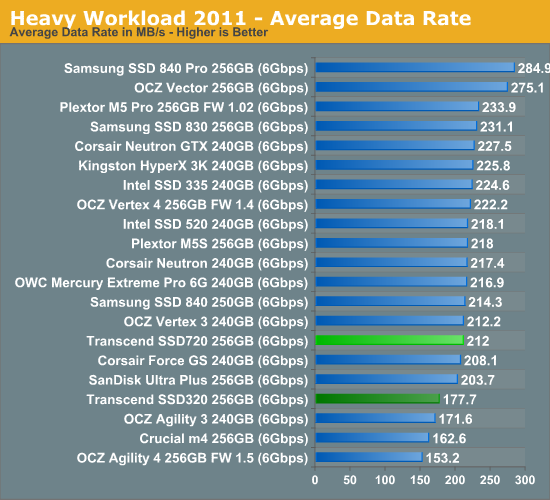
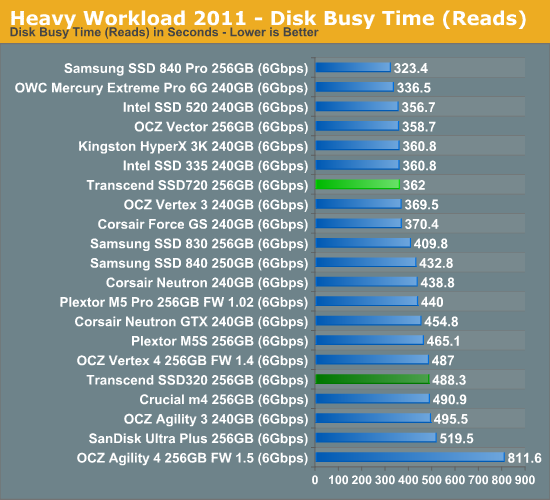
Our Heavy suite pretty much summarizes the results we saw in synthetic tests. The SSD720 is around 20% faster but most of the difference comes from its faster read speed, which is largely due to SSD320's poor read performance with incompressible data.
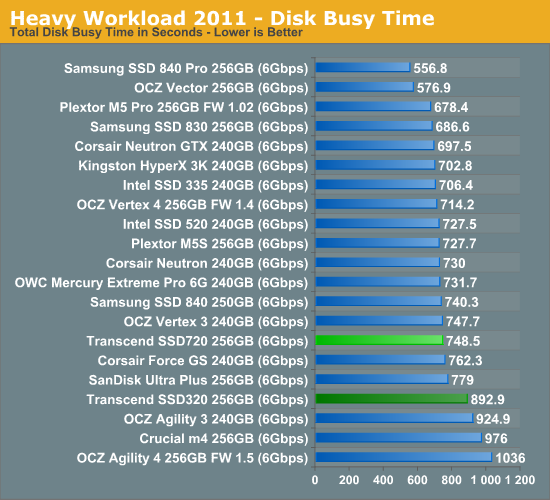
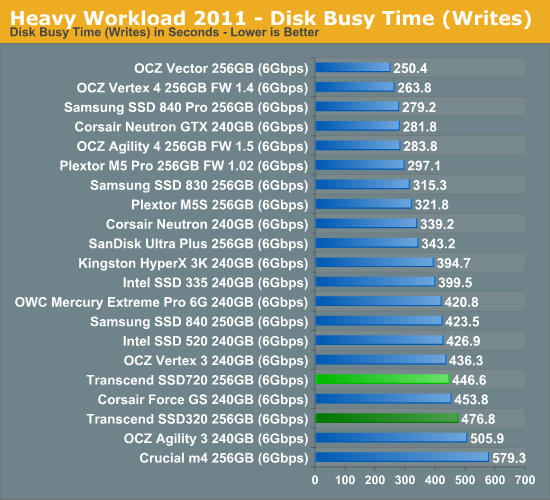
The next three charts just represent the same data, but in a different manner. Instead of looking at average data rate, we're looking at how long the disk was busy for during this entire test. Note that disk busy time excludes any and all idles, this is just how long the SSD was busy doing something:


34 Comments
View All Comments
paul878 - Friday, January 25, 2013 - link
For a second I thought they were 320G and 720G drives.Azurael - Friday, January 25, 2013 - link
So what's the difference between a Sandisk Extreme SSD and a Transcend SSD720? How many more identical SSDs can the market support?Flying Goat - Friday, January 25, 2013 - link
If you tried to skip the drives over a lake, you'd find that one was most likely designed with aerodynamics in mind, while the other was not. Sadly, we're just never going to see the sort of truly complete feature comparison at AnandTech that covers that sort of thing. :)gammaray - Friday, January 25, 2013 - link
i dont know, but i got the SanDisk extreme 240gb home and its ultra fast and paid 160$ on sale for it :Dembzyk - Sunday, January 27, 2013 - link
9.5mm vs 7mm heightEgg - Friday, January 25, 2013 - link
The Transcend SSD720 256GB achieves a busy time of just over half that of the Samsung SSD 840 Pro 256GB, and it's missing a decimal place.This seems highly suspect.
Kristian Vättö - Saturday, January 26, 2013 - link
Oh, you're right, there was a typo. It should've been 362 instead of 162. Fixed! :-)iwod - Friday, January 25, 2013 - link
SSD1st Gen - SATA ; Response Time Reduction Compared to HDD
2nd Gen - SATA II; Higher Seq Read Write
3rd Gen - SATA II; Better Random IO
4th Gen - SATA III; Overall Improvement to both Seq and Random
5th Gen? I think Next Gen we need SATA Express and something similar to Intel's Consistent I/O Performance.
Tech-Curious - Saturday, January 26, 2013 - link
Eh, there's still a fair amount of head room on the SATA 3 interface. Wouldn't expect PCIe to become the norm for at least another two generations.Tech-Curious - Saturday, January 26, 2013 - link
Sorry, misread your comment, iwod. Still, even if sequential speeds remain more or less stagnant, there's a lot of room left to improve random read/write with SATA 3.